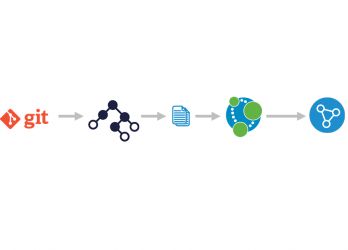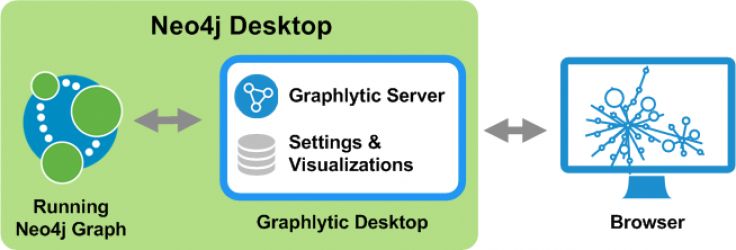


How to Visualize Java Source Code with Graphlytic and jQAssistant
Looking at source code in the form of a graph can bring multiple benefits for the team. This post will show how to quickly set up graph visualization of a Java codebase using Maven, jQAssistant, Neo4j graph database, and Graphlytic Desktop.


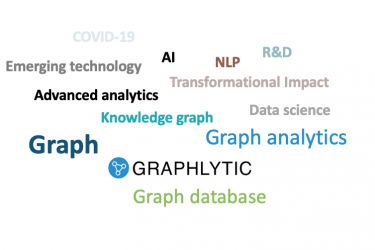
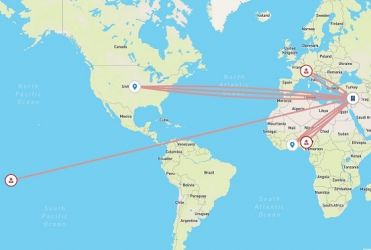
The power of a visualized UK business environment
Are you interested in finding out how open data might provide you with a detailed map of a business environment? Risk Hunter is a unique visualized graph platform for researching and investigating UK companies using connected data, powered by Graphlytic. See how it works.

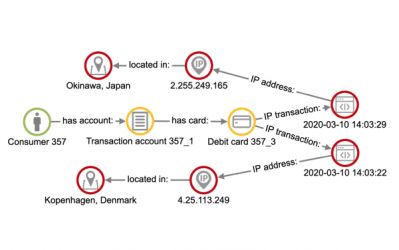
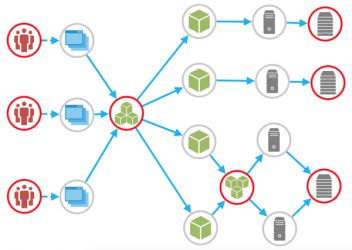
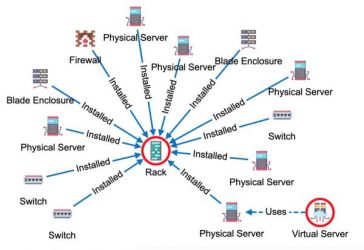
How to Visualize Your IT Network Infrastructure with Graphlytic
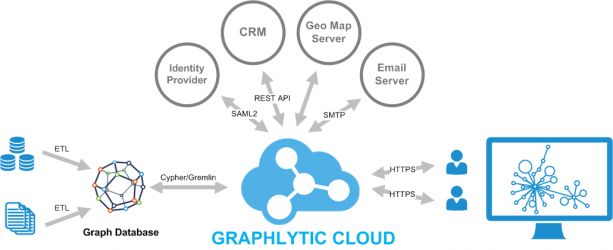
Graphlytic visualization is a useful tool to maintain the documentation of IT operations, which can be up and running in a few days. We'll show you the benefits it brings for network specialists; how to fine-tune it to prevent major outages; and how to feed it with data stored in various sources.


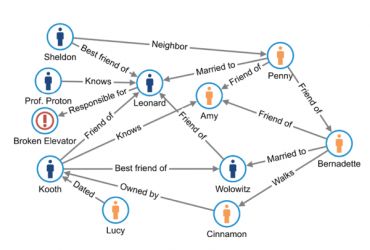
How to set-up Query Templates for non-technical users
Graphlytic admins can now construct use-case specific Query Templates for the users to work in a simple and intuitive UI. No technical background for users needed. Even complex querying with a mouse button click. Enormous efficiency. Professional outcomes.