
The main purpose of this blog post is to introduce Graphlytic as an optimal application to efficiently assist with the documentation of IT operations, with a really fast set-up and easy user onboarding. Later in the article, we'll deal with these sub-topics:
Our experience confirms the fact that the Graphlytic visualization helps clients with network documentation, configuration management, and network impact analysis. It allows users to define and explore dependencies to 10+ levels. The users with permissions and system admins can create, update or remove network components directly in an interactive Graphlytic canvas. Regular activities, such as feeding Graphlytic with data from DBMS on a daily basis are managed by ETL 'Jobs'. The CMDB can be exported on request or on a regular basis as well, in order to update other systems defined by the customer.
Graphlytic's technical benefits include: removing bottlenecks; increased efficiency in CMS planning and operation; and increased knowledge in support teams. The main financial benefit is the decreasing costs for network operations. Working in a smart intuitive Graphlytic UI is a matter of overall efficiency improvement.
A more detailed description of the main pains of operating IT networks and benefits for network operation managers using Graphlytic are described in our general use-case IT Infrastructure Graph Visualization.
Let's assume that we have Graphlytic installed and running. Our goal is to use the Graphlytic application as a professional tool to support the documentation of IT operations. We need to pass two stages to make that happen - 'Prototype Preparation and Testing', and 'Implementation in the Production Environment'. Let's see what they cover:
The prototype should prove the functionality of the Graphlytic application and the benefits for the network managers, described in Part 1. The prototype works with just a sample data set from an existing configuration management tool to confirm the assumptions. When creating a prototype, we might need to consider other topics such as integrations with the existing environment or other systems.
We'll show you how set-up a functional prototype, that after successful testing, will qualify Graphlytic in the production environment to work as a single source of truth documentation tool for configuration management.
The detailed description of setting-up the prototype is described in this post: Typical Project of Custom On-premise Graphlytic Installation with Graphlytic Team. For the purposes of this article, we'll introduce four separate phases of prototyping the visualization application to support IT operations documentation in separate sections:
The purpose of the testing is to find out if the visualization reflects the data model and the real configuration of our IT network. If something doesn't feel right, we have to check in which phase we need to make corrections. When everything works fine, and the users are able to explore the data set, we can move on to the implementation of the Graphlytic application in the production environment.
After successful prototyping, it should be quite easy to integrate the Graphlytic application for IT network documentation support into the production. We need to define the users, groups and adjust permission right.
We have to use the "whiteboard approach" and draw the original data model for our use case. Data model helps us simplify and put down to a "one-pager" every possible relationship between network elements that might exist in the network. In the future, it will support us with network topology, and it must be kept up-to-date. For the purpose of setting up the Graphlytic as a documentation tool to assist in IT infrastructure operations, we need to visualize basic elements of the IT infrastructure and the relationships between every pair of elements. We have to consider the physical and logical model of network and hardware infrastructures. We can also think about which components are related to data transfer and which to the computing performance or services to users.
Let's imagine that we are a mid-size company that develops and delivers certain business applications to their customers. Some of the applications are considered business-critical. We operate in eight geolocations, additionally, our servers are located in two independent data centers. Our data network consists of racks (or a pair of racks) in every location, with devices such as firewalls, load balancers, routers, and servers. The physical servers run various operating systems, databases, and services are managed on virtual machines in distinct clusters. To keep things simple for our explanation, in further reading let's keep network elements registered in double-digit numbering (e.g. 'Rack 78') and database IDs of the devices in three-digit numbering (e.g. 500 for 'Rack 78'). Below you can see an example of a data model for our IT infrastructure:
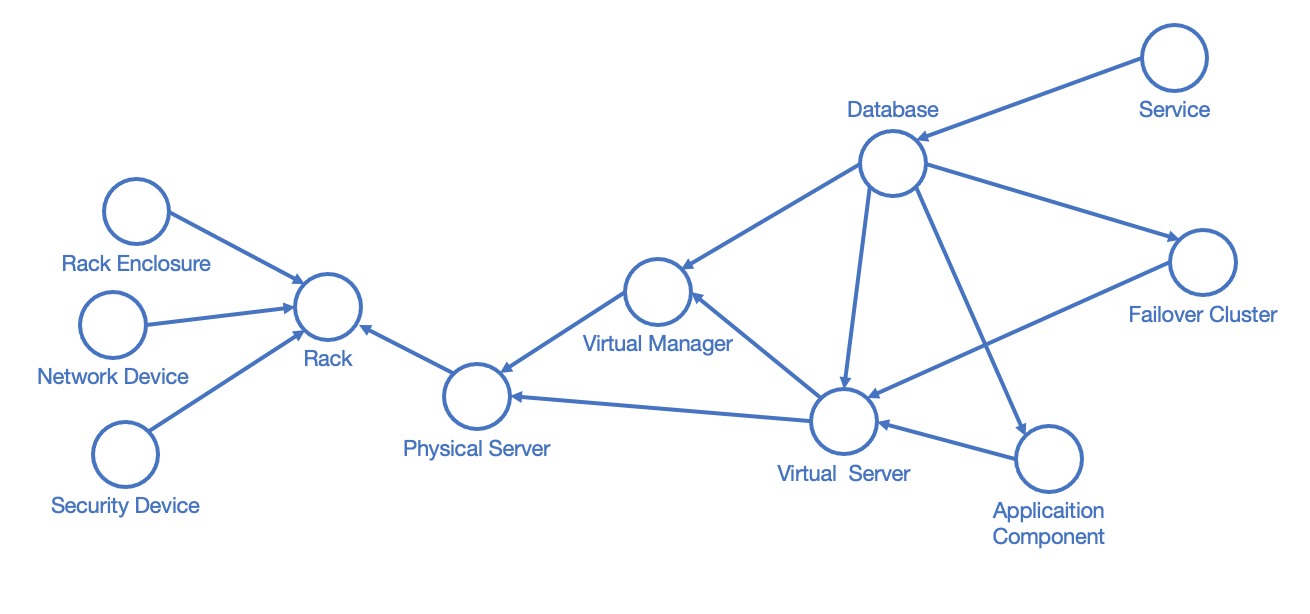
A verified data model depicting existing dependencies in the network is a good starting point for building the prototype.
To validate that the prototype works, we need to test it with a sample data set. We can use anonymized data (such as we'll do in this post) or simply export a sample data set from our present IT documentation tool that contains several representative components of our IT network.
In our example of a mid-sized company, our source database export could look like this (highlighted rows will be explained in the text later on):
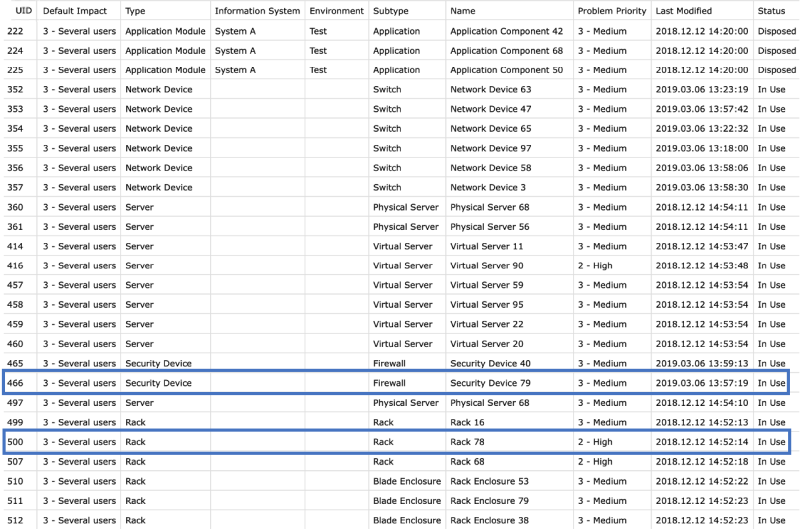
We can see that the rows in our exported database directly represent nodes from our data model. We'll convert this sheet into CSV to import the nodes' data set into Graphlytic.
What we need to do now, is to assign the relationships to the nodes according to our data model. How do we do it? First, we have to identify what dependencies or relationships exist between network elements already entered into our existing IT operations support tools.
In our example again, our current documentation should contain the network architecture with all network elements identified and the way they are connected at different levels (e.g. physical, logical) specified.
For example, in our "Location X', there is a 'Rack 78' with DB ID 500 protected with a 'Security device 79' (the firewall) with DB ID 466. There are several network devices connecting the location into a 'wide area network' (WAN) such as 'Network Device 47'(switch) with DB ID 353. In 'Rack 78' there are 11 physical servers installed, with various virtual servers that run various application components. You can find the already mentioned 'Rack 78' and 'Network Device 47' in the above-attached database export, with DB IS, as well as the other properties that are already assigned to the infrastructure devices, such as 'Type', 'Subtype', 'Problem Priority', 'Status', etc.
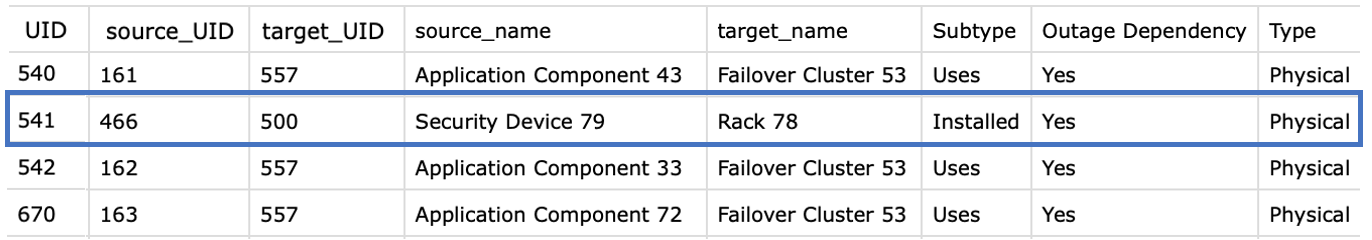
To prepare an import database of relationships between every pair of IT network devices (i.e. nodes), we have to get an additional export from the existing documentation that covers the relationships. Once we have it, we'll use some automated operations to extract a simple database with rows where each row contains a record of 'source node' such as 'Security device 79' and 'target node' such as 'Rack 78' with their DB IDs. To get a better understanding let's have a look at the second import file to the Graphlytic application - the CSV file with relationships definition. The CSV import file needs to have a standardized structure with the first three columns as follows: 1. 'relationship ID', 2. 'source node ID', 3. 'target node ID'. The other rows contain additional relationship properties.
In this chapter, we'll talk about feeding the Graphlytic application with data. Generally, there are three options:
As mentioned in the sub-title, we'll do our initial data-set import. We'll use the manual import of the IT network DB sample, transformed into two CSV files as described in chapter 4.
After we imported the sample data into Graphlytic - 2 CSV files with nodes, and relationships, followed by mandatory re-indexing of the full-text search configuration - we can and we need to explore the data set to test if the visualization reflects the data model and the real dependencies in our IT infrastructure network. After adding a few nodes from an underlying graph DB into visualization, and exploring their relationships, we'll find out really quickly if the Graphlytic application works with our data correctly.
Let's come back to our example of the visualization of a mid-sized company IT network, and assume that we confirmed that the Graplytic application truly reflects our IT network. With the below-attached short video clips, we'll introduce several scenarios where graph visualization is ultimately beneficial:
Outage propagation is a feature and widget dedicated to IT network operations use-cases. The outage propagation feature is applied to simulating IT network component outages with the consequent spread of outages in the network. The functionality of outage propagation is based on the fact, that certain network components are dependent on the other network components.
The common scenario in IT network operations use-case is that application services are often dependent on running virtual environment, that is installed and dependent on physical servers, that again are dependent on the physical infrastructure, such as racks and network devices. The 'Outage propagation' button is placed in the upper 'Tools panel'.
In our example, we can see, how easy it is to simulate the outage of the rack in one of our locations. By selecting the 'Rack 16' and clicking on the 'Outage propagation of selected node' we can follow the simulated spreading outage. As we mentioned before, and proved by the 'Outage propagation' scenario, our network model is reflecting the aim of high availability of 'Application Components' that are simultaneously delivered on infrastructure placed in three independent geo-locations.
You can try all features related to IT infrastructure visualization described in this article here: IT Infrastructure Demo.
The question here is, "How you can get up and running in minutes?", as we just claimed.
First of all, you have to decide, which Graphlytic instance is optimal for your case.
At any point, you can ask us to help you validate your intentions with graphs by sending your enquiry mail to info@graphlytic.com. If needed, we'll set up a call to discuss technical points and answer your questions
Demtec, s.r.o.
Karpatské námestie 10A
831 06 Bratislava
Slovakia
ID: 47807890
VAT ID: SK2024104434
EMAIL: info@graphlytic.com
TEL: +421 944 289 809