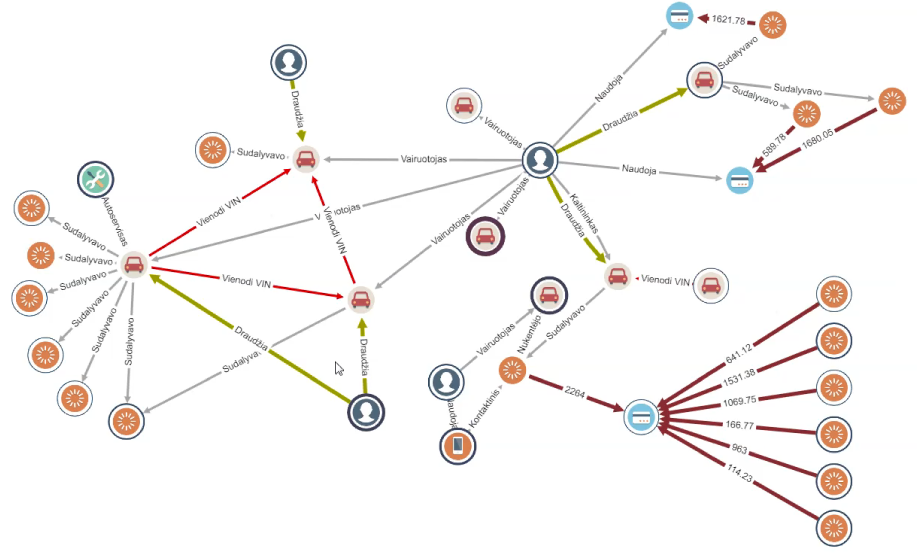
Fraud analysts and investigators face the trend of increasing amounts of data for processing, as fraud continuously evolves. Growing amounts of data have to be searched throughout traditional databases in non-user-friendly environments. Additionally, a lot of manual effort and time needs to be spent to analyze and detect fraud rings properly. Moreover, fraud analysts need to deliver precise, perfect results in shorter and shorter periods of time; ideally in real time.
Fraud pattern is a well-known term to every single insurance company, bank or e-commerce enterprise. Modern fraudsters build sophisticated fraud rings and schemes that are hard to unveil with traditional tools. These can cause serious losses if not detected properly and on time. On the other hand, traditional red flag systems with too strict criteria must be adjusted to eliminate false positive indicators, as it would lead to overwhelming fraud indications. Great amounts of time are spent trying to detect complex fraud, paralyzing investigators in their daily tasks.
Disruptively changing markets and strong competition push every company to meet clients’ needs more quickly, opening up new opportunities for fraudsters:
Demanding clients with their needs and high expectations.
Professionally organized groups, virtual circles, stolen and synthetic identities, hijacked devices, offshore accounts.
Rapidly changing business environments; increasing amounts of data; and evolving fraud methods that require increasing resources for every bank, insurance or e-commerce company.
An ideal solution to this situation is a graph visualization powered by Graphlytic as a powerful support to traditional antifraud tools.

The basic idea behind Graphlytic is the fact that the human eye can simply distinguish and find any pattern in a graphical form much easier than in any table or data set. It means that the antifraud analyst can capture fraud schemes within graph visualization more easily, faster and smarter than with solely traditional tools.
It is easier for antifraud analysts, after short training, to be able to work within an intuitive and easy to use environment. Easier, as analysts’ eyes can easily identify what is hard to identify in tables.
Faster, as the manual analysts’ review time per case will be decreased significantly! The antifraud department can then review multiples of transactions monthly compared to the situation before a graph visualization solution was implemented. Speaking in financial terms, faster means saving significant resources!
Smarter, as by visualizing the relationships between the subjects in antifraud analysis, you can operate more extensive searches and depict previously unnoticed fraud connections. Again, smarter in this way means saving another pile of resources, that otherwise would end in the hands of fraudsters.