Use Case

IT Infrastructure Graph Visualization

Smarter and more efficient management of your IT operations

Growing complexity of all data networks needs adequate support.

Companies running their IT operations on their own infrastructure, data centers or cloud, Telco or IP providers, all need a solid network documentation and a functional configuration management. Impact analyses describing interdependencies among network elements (active and passive) are being developed to overcome black-outs, which cause significant financial losses, or even single outages causing no or low availability of service. Bottlenecks and single points of failure are determined and solved. End-point as well as route redundancies are being implemented.

Service availability or network component functionality are in play. IT asset management is another huge area defining the efficiency of invested financial resources.

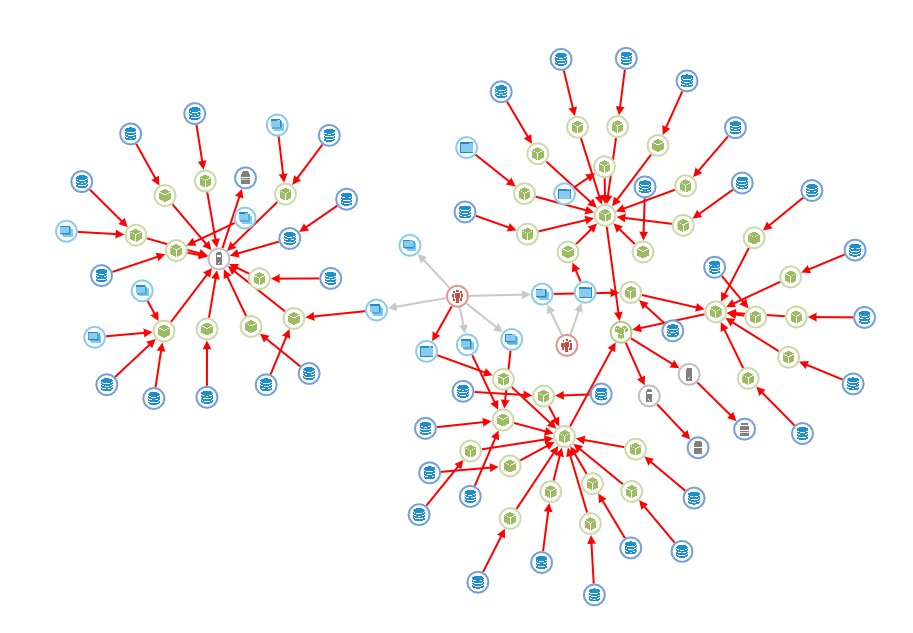
Graphlytic property graph visualization is a perfect enabler for all above mentioned points - network documentation, network configuration management, impact analysis and asset management. It stores and depicts all relevant network configuration information bringing these main benefits:

  1. It increases the efficiency of planning and decision-making processes as it enables users to analyze all Configuration Management System (CMS) data in one place, bringing the answers to the following questions, for example:

    What services will be affected by an X component failure?

    How many X components are deployed in Y network?

    Which elements support the operation of a certain component in CMS?

    Which part of the network needs to be shut down when replacing X component?

    Which teams need to participate and/or to be strengthened when a new service or component is in the roadmap?

    Where are the bottlenecks in the CMS structure?
  2. It simplifies the operation of the CMS and makes it smarter due to interactive graph visualization.
  3. It increases the knowledge in solution teams when using a single access point to CMS data.
  4. It increases the quality, topicality and availability of CMS data using visual controls and interactive application feedback.
  5. It increases the data security resulting from detailed data access management.
  6. It decreases the costs for IT infrastructure / services changes due to faster and more efficient planning.
  7. It decreases the costs for the provision of support of higher quality operational information.
  8. It decreases the costs for system operations due to more efficient bottleneck / SPoF analysis.
  9. And, last but not least, it increases customer satisfaction as a result of a more proactive approach and faster time to respond and faster time to repair when incidents occur.

Modelling of IT Configuration Items

Try our free online demo IT Infrastructure to see Graphlytic in action.
Blogpost How to Visualize Your IT Network Infrastructure with Graphlytic shows how Graphlytic can be used to import your configuration database data and interactively visualize the whole network.
Blogpost How to set-up Query Templates for non-technical users with step-by-step tutorial to set up query templates for repeating IT infrastructure analyses.
Blogpost Manual Graph Modeling that shows how Graphlytic can be used to gather data about infrastructure in an interactive and easy to use way.

Summary

Pain points / Challenges
  • Network documentation and troubleshooting the outages
  • Complex and constantly growing networks with increasing interdependencies among nodes
  • Configuration management / configuration entities with high number of relationships between them
  • IT asset management – need to manage and report value and ownership of financial assets
Solution
  • Network visualization in the form of a graph visualization
  • Strong support tool for network documentation and impact analysis
  • Analytical graph visualization of CMDB for IT operation management
  • Server implementation or cloud instance of Graphlytic
  • Description of logical and technical architecture, and application configuration
  • Modeling patterns proposal for configuration management
Benefits
  • Graph visualization of complex networks and infrastructure overview in a most natural form
  • Uncovering bottlenecks, outages planning and prevention
  • Realtime alerts
  • Significantly decreased resolution time in case of failures
  • Standalone solution with user rights management – read-only analytic visualization tool or full access with manual modeling option
  • Data from various sources e.g. ITMS in data centers, monitoring tool, ERP
  • Fast search and impact analysis