Neo4j Desktop is a really useful application for every graph enthusiast, developer, or analyst who uses Neo4j regularly.
Graphlytic's main goal is to make graph modeling and analytics for day-to-day operations as simple and straightforward as possible. We are constantly adding new features to the visualization and automation modules because we believe that working with graphs, answering questions based on graph data, and task automation with graphs should be easy and accessible, even without any or only very little technical knowledge.
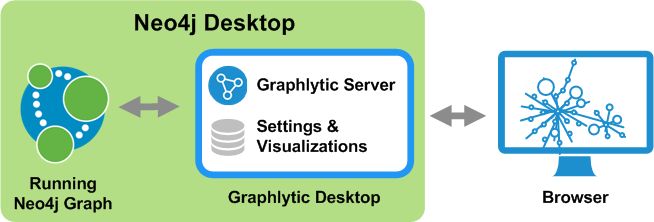
Graphlytic is a graph analytics and visualization web application that can be installed in several ways, and one of these ways is to install it in Neo4j Desktop for local usage. This article covers the steps needed to install and run Graphlytic in Neo4j Desktop. If you are interested in the on-premises installation or you need a Graphlytic Cloud instance, please check our Pricing.
After having Neo4j Desktop installed, you can connect Graphlytic easily:
1.Open the Neo4j Desktop application on your machine.
2.(Only for Neo4j Desktop older than 1.6.0) Go to the "Graph Applications" page (in the left menu), find the "Install" input field, enter the Graphlytic Desktop app URL:
and click the "Install" button (another option is to add Graphlytic Desktop directly from the Graph Apps Gallery, but this does not work on every OS).
3.Start a local or remote Neo4j Graph instance. Here's a step-by-step tutorial on How to connect to a remote Neo4j instance.
4.Start Graphlytic and connect it to the Neo4j Database using this information:
Here is a short clip of all steps in installing and running Graphlytic Desktop with an existing Neo4j Graph:
So, what can you do with your freshly installed Graphlytic? There are several use cases where Graphlytic can be very helpful with its features, e.g.:
We are striving to get the right balance between two opposite things - simple graph UI and support for complex tasks. We have achieved this by a combination of extensive configuration options and bespoke customization. Graphlytic is ready to be used out of the box for any graph data but the true value is in configuration options like Data Schema, Styling, User Groups, Application Permissions, Data Access Management, or Scheduled Jobs (all described in more detail in the next chapters).
For modeling use cases (manual gathering of data) Data Schema configuration can be used for defining restrictions like read-only properties, predefined lists of values for data inputting which leads to better data quality. Default virtual properties can be also defined in Data Schema. Virtual properties are small JavaScript functions that return a value and are very useful for calculating derived values like performance indicators, flags (true/false values) which can be then used for visualization styling. The nice thing about virtual properties is that they are calculated in the scope of the visualization so when you add or remove nodes and relationships from visualization virtual properties are recalculated and new patterns emerge.
User can modify pretty much any aspect of the visualization with the UI but in most cases, a common understanding and interpretation of the graph data are in place. This common interpretation can be used to create default (globally accessible for all users) styling objects like mappers and default visualization settings which are then used as a default setting every time the user creates a new visualization.
With this configuration, it's possible to create a repository of predefined queries or run a custom query. There are different types of queries that can be created.
Graphlytic is a web application where only defined users have access. Users can be grouped into groups, and these groups can have all sorts of things defined with Application Permission, such as whether users of this group can only read data or if they can also input data. If they can export data, share visualizations, change global settings, create jobs, and more.
Every user group can have different permissions regarding which part of the graph (nodes and relationships) and which properties can be or can not be accessed by users of this group. This allows creating specialized user groups that have restricted privileges, like can access the graph itself but can not access financial data stored in properties, etc.
Graphlytic contains an ETL module (Extract, Transform, Load) which allows creating jobs in form of an XML document that defines a set of steps that are executed when the job is started (manually or scheduled with CRON like expressions). Every step can produce a dataset that is then passed as an input to the next step. Steps are defined as the usage of a driver with specific parameters. Graphlytic includes for instance drivers for CSV, Neo4j connection and Cypher execution, Mail, Groovy, Log, Text, XPath. New drivers can be inserted into Graphlytic installation, like when you need a specific JDBC driver or when you want to create your own driver in Java for some use case-specific post-processing after data update.
Did Graphlytic get your attention? Please contact us at info@graphlytic.com if you'd like to ask us anything or to help you assess the viability of the solution for your use case.
To understand better what can be achieved with the application, take a look at these blog posts:


Demtec, s.r.o.
Karpatské námestie 10A
831 06 Bratislava
Slovakia
ID: 47807890
VAT ID: SK2024104434
EMAIL: info@graphlytic.com
TEL: +421 944 289 809


