Introducing the 4.2 version of Graphlytic - graph analytics software, designed to help you gain insights into complex networks and data structures.
This release is focused on graph query management and "quality of life" improvements in visualization. We will cover the most important improvements in this post and the full list of changes can be found in the Release Notes.
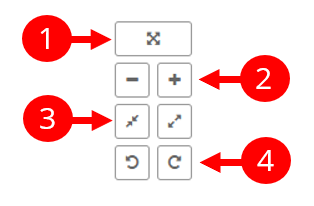
Graph rotation is a new feature for layout manipulation in visualization. Since there are a couple of different ways to stretch, zoom, or rotate the graph we have decided to redesign the zoom controls in the left top corner of the canvas to have these options in one place.
Support for multiple titles in the visualization allows multiple property values to be shown under nodes or on relationships. If a property is not defined for some elements then this property is skipped in the titles.
This is quite handy in case you want to show different property values for each element type or category. Let's say there is a "name" property for Company nodes and an "address" property for Address nodes. Just add "name" and "address" properties in the Titles setting and each node will show the appropriate value in the title.
Saved visualizations in Graphlytic can be used as a static snapshot of a particular state in the graph. When a visualization is opened you can choose if you want to see the saved state or if you want to automatically refresh elements data and show what was changed (This is the default behavior. To change it take a look at the Loading Modes).
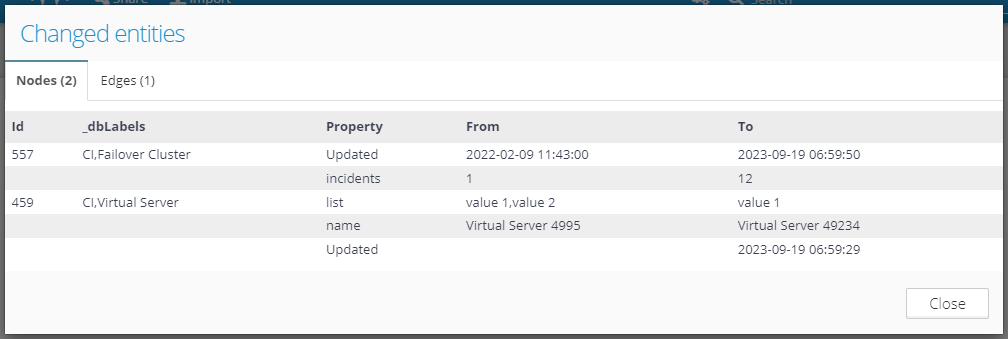
After a saved visualization is opened using the REFRESH mode and there have been some data changes then this notification is displayed:

After clicking on the "Show all changes" link a modal window with all changes is shown.
Writing custom queries or query templates (in Cypher or Gremlin) is an important part of every advanced solution. Mainly query templates are enhancing the solution for non-technical users with the ability to hide complex queries behind a simple form. We have improved the query template editor to make this process more convenient and faster.
The process of creating a query template was reduced to:
This query template:
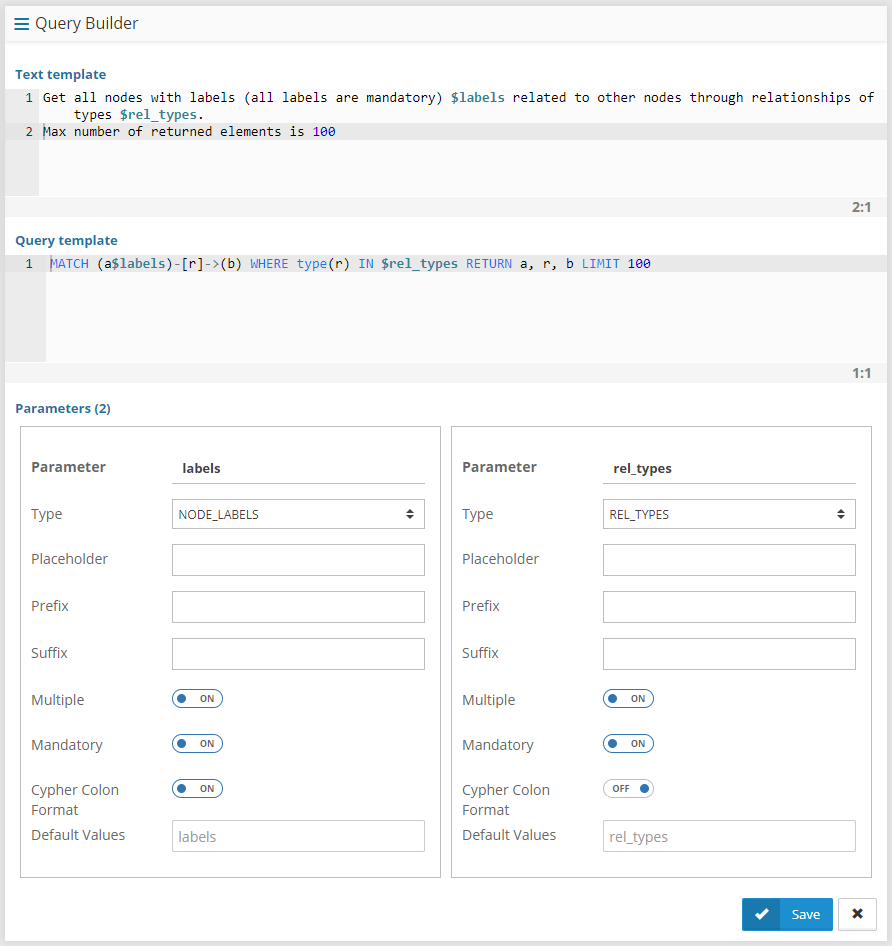
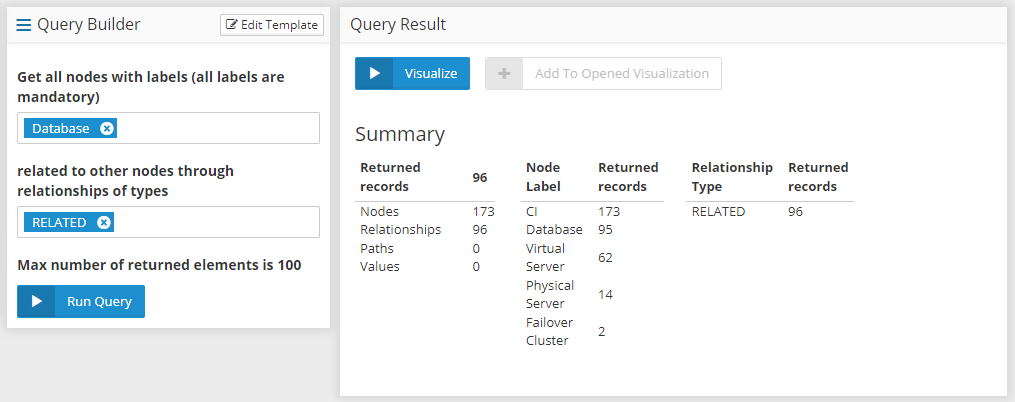
is turned into this form for the user:
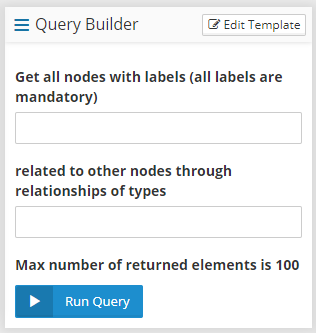
Users can simply type in values into the form (suggestions are listed when the user starts typing) and then run the query without knowing how is the actual query constructed behind the scenes. A summary of the result is presented and the user can easily visualize it with the "Visualize" button.
Contact us or leave a comment below if you would like to know more or schedule a demo.
Demtec, s.r.o.
Karpatské námestie 10A
831 06 Bratislava
Slovakia
ID: 47807890
VAT ID: SK2024104434
EMAIL: info@graphlytic.com
TEL: +421 944 289 809