I'm happy to announce the release of Graphlytic 3.4. This release is focused on bringing all the configuration options from config files into the app. It's now very easy and convenient to set up and manage Neo4j connections, single sign-on, or SMTP integration directly in the app without the need to restart it. Another major change is in the way how the saved visualizations are loaded. Users can choose between different strategies and one of them is particularly useful for creating dynamic dashboards. Let's dive right into it.
Note: full release notes can be found here: Release Notes
Before the 3.4 release, every time a saved visualization was loaded, the data (properties on nodes and relationships) was reloaded from the graph database, all values were compared to the saved state (snapshot state) and any detected changes were presented to the user.
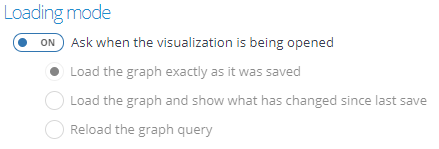
We have added two additional loading modes and the option to choose an appropriate mode during visualization loading.
Available loading modes:
Which loading mode should be used or if the user can choose it when the visualization is being opened, can be configured in every visualization separately on the Settings tab:

To create a dynamic dashboard from a query template we need to create a visualization using a query template first. Step by step tutorial can be found in the blog post How to set-up Query Templates for non-technical users. Then the Loading mode has to be configured to "Ask when the visualization is being opened" and the visualization saved.

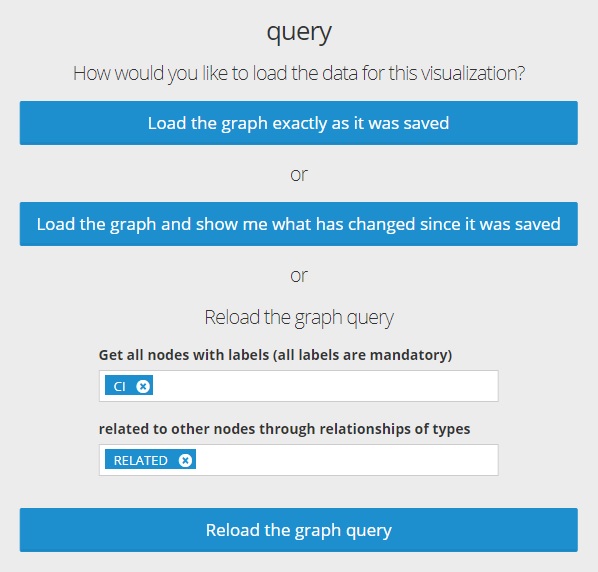
Now when the user (or any other user that has access to this visualization through sharing) opens the visualization the loading options are displayed:

Here the user can change the dynamic values for the query and reload it using the "Reload the graph query" button. After that, the query is started and the result is visualized using the settings saved in this visualization (e.g. styles, timeline, and other configurations).
We have added a couple of other improvements in the visualization like better support for Neo4j data types and arrays in manual graph modeling, a lot of new keyboard shortcuts (shown in tooltips), exploring filter active indicator, option to visualize all found nodes from the fulltext search with one click, and my favorite - Undo/Redo for node positions:

Graphlytic's backend is undergoing a lot of major changes with the first batch of changes being released in this 3.4 version. The focus in this release was to bring all the "hidden" configuration options from the configuration files into the application. That's why the starting procedures and the Settings page were completely reworked so now it's not needed to restart the application after any of the integration options is changed.
Deployment configuration of the app using the environment variables or the graphlytic.conf file still works but these configurations are considered to be the "default" settings for the app. That means you can change the settings directly in the app and it's possible to go back to the default with the "Reset to default" buttons.
For more information about the available default settings please refer to the documentation: Configuration
New settings available in the app are:
Contact us at info(at)graphlytic.com if you'd like to schedule a demo or leave your questions in the comments below.
Michal Habala
CEO