Looking at source code in the form of a graph can bring multiple benefits for the team. From routine checks for forbidden patterns to checking cross-module dependencies or refactoring workload estimations. Some tasks can be at least partially automatized and in others, information for decision making can be obtained much faster and in the form of interactive graph visualization.
This post will show how to quickly set up graph visualization of a Java codebase using Maven, jQAssistant, Neo4j graph database, and Graphlytic Desktop.
The setup involves several steps:
To install jQAssistance in your Maven project simply add the plugin dependency into your pom.xml file:
<properties>
   <jqassistant.version>1.11.1</jqassistant.version>
</properties>

<build>
   <plugins>
      <plugin>
         <groupId>com.buschmais.jqassistant</groupId>
         <artifactId>jqassistant-maven-plugin</artifactId>
         <version>${jqassistant.version}</version>
         <executions>
            <execution>
               <goals>
                  <goal>scan</goal>
                  <goal>analyze</goal>
               </goals>
               <configuration>
                  <warnOnSeverity>MINOR</warnOnSeverity>
                  <failOnSeverity>MAJOR</failOnSeverity>
               </configuration>
            </execution>
         </executions>
      </plugin>
   </plugins>
</build>
The jQAssistant is re-generating the graph from the Java source code every time the project is built. The Neo4j graph database is used as the storage for the graph, the generated database folder can be found in the /target/jqassistant/store folder in your Java project after running:
mvn clean install -DskipTests
To bring the graph to the life you can either copy the generated /store folder into an existing Neo4j server or you can simply run the jQAssistant's embedded Neo4j server (do not forget to stop the Neo4j server before running any other Maven commands).
To start the embedded jQAssistant's Neo4j server run:
mvn jqassistant:server
The jQAssistant's embedded Neo4j is a 3.5.x version with default settings:
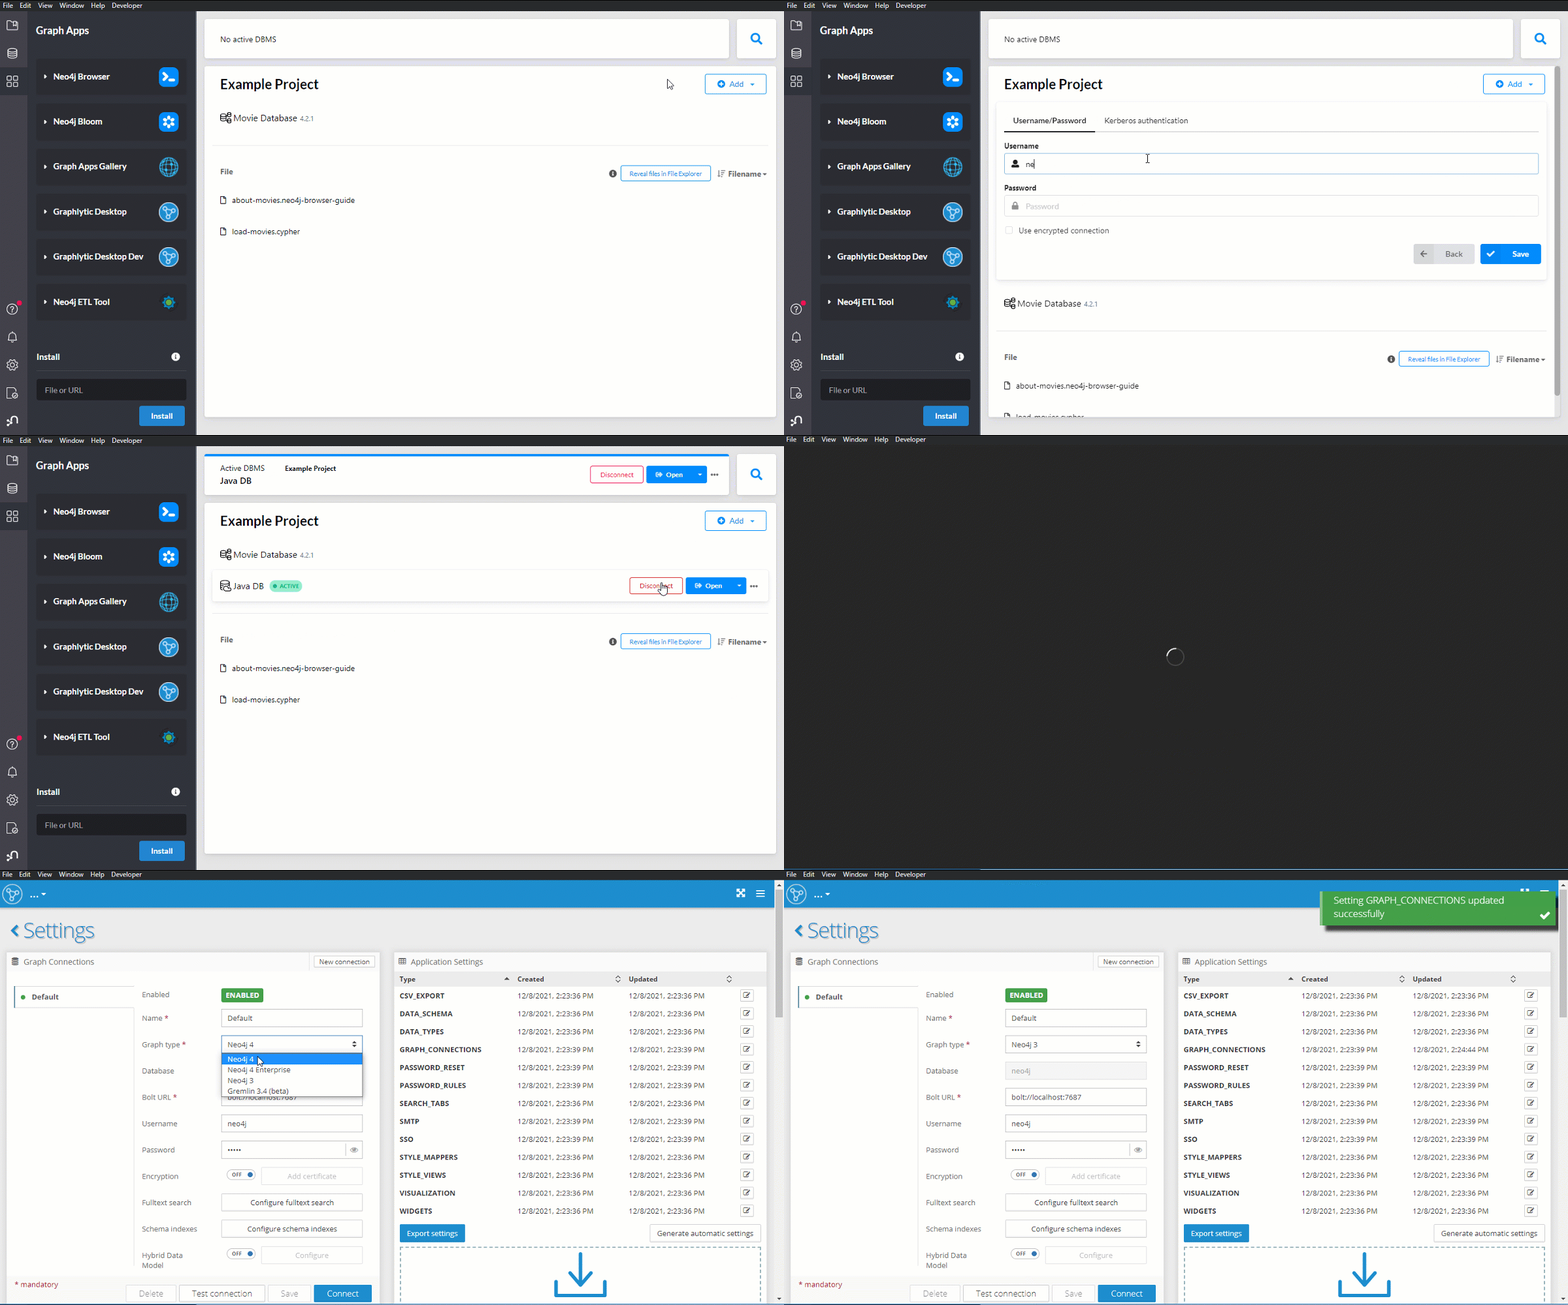
To add this graph into Neo4j Desktop we can simply add it as a remote database and then run Graphlytic Desktop (see clip below).
Do not forget to change the Neo4j connection type to Neo4j 3 in Graphlytic's Settings.
Now we can make our first visualization and start looking into the graph. To use the fulltext search we need to configure the Neo4j fulltext index first and then we can search for specific classes or methods in the graph.
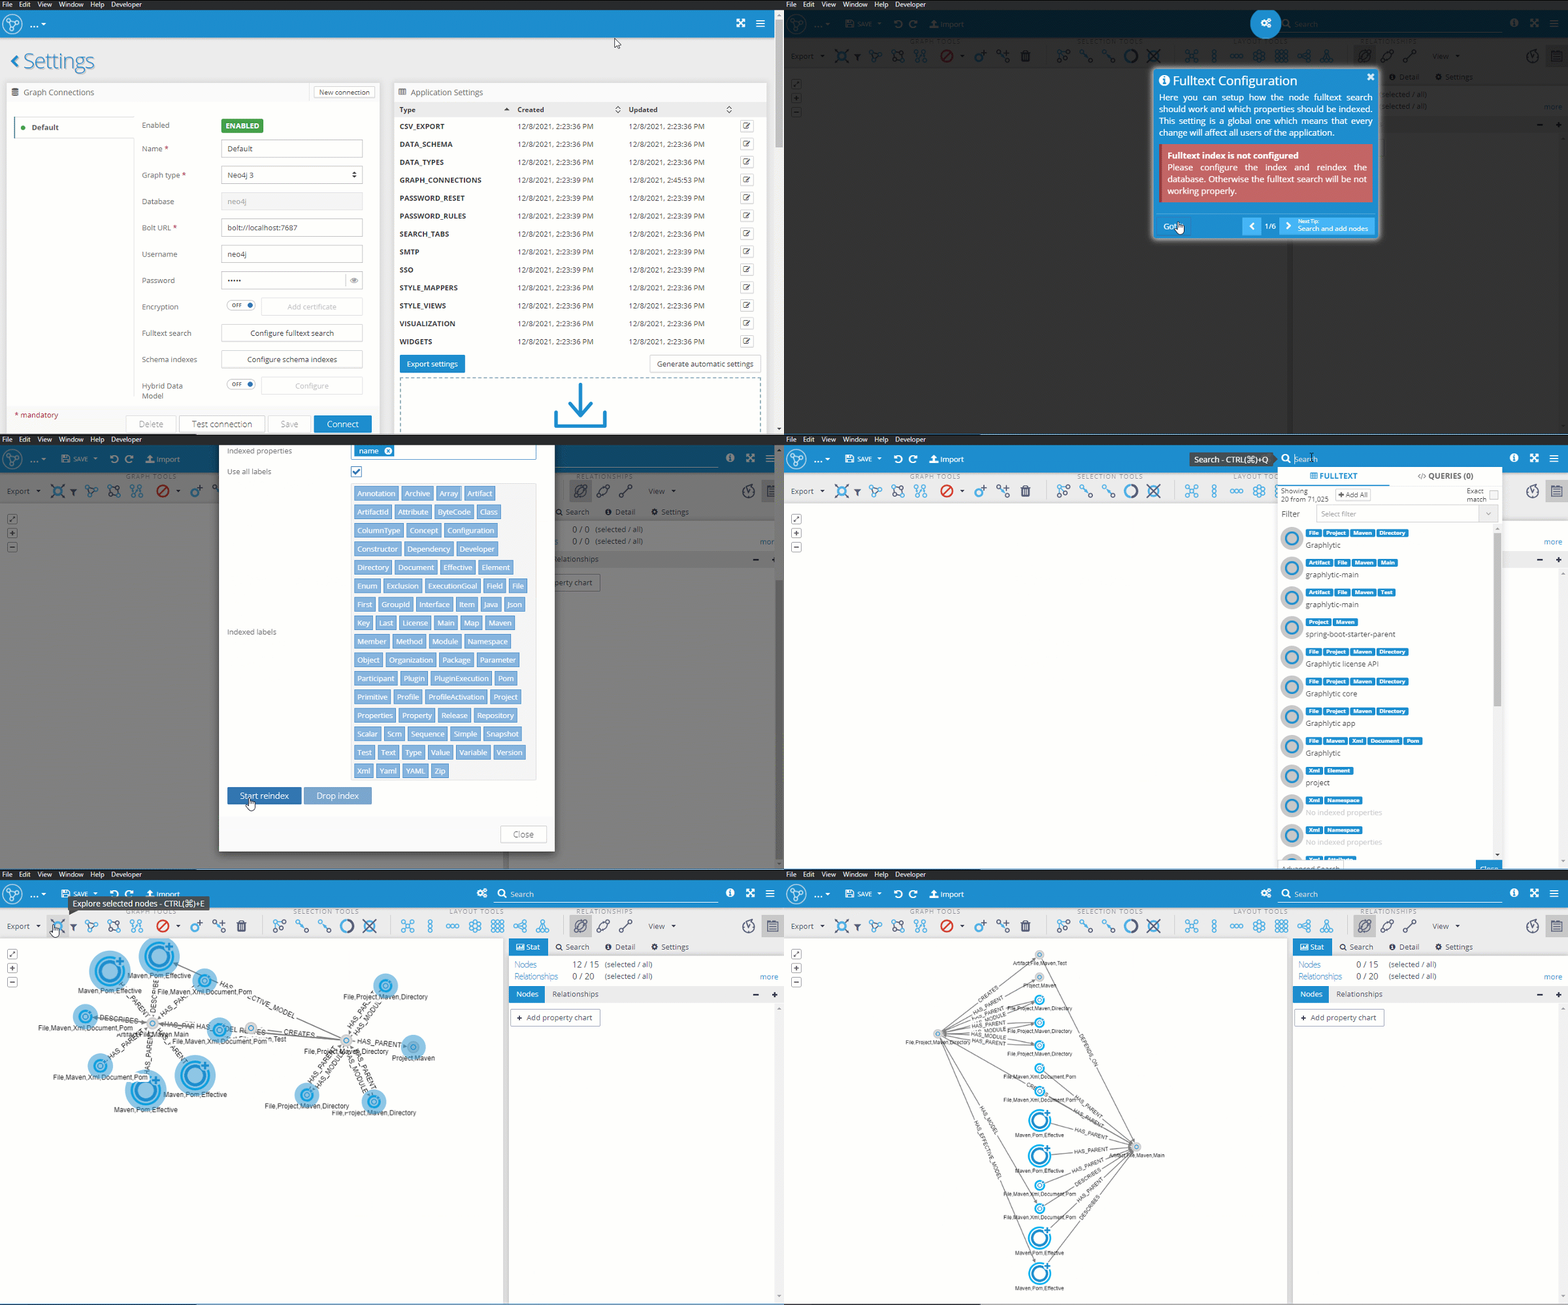
Adding icons or colors to your visualization is always a good idea and can greatly help in a faster understanding of the data. Take a look at this blog post to learn the styling basics in Graphlytic.
The jQAssistant generated graph has a great level of detail. In fact, it's so highly connected and structured that it may be sometimes hard to find the answer to simpler questions because it's buried in a maze of relationships and intermediary nodes that are not necessary for the task at hand. For such situations, we can use graph projections that can simplify the graph for specific purposes. To learn more take a look at a few examples in this blog post: Graph Projections Automation with Graphlytic. The graph model used in the examples is the same jQAssistant graph that we have constructed in this post.
