Imagine a situation where you have a high-detail knowledge graph put together from multiple data sources. Everything is great but chances are that a lot of questions that should be answered using this knowledge graph require a lot lower level of detail and all the branches in your graph are making the task hard to solve. It's like finding a needle in a haystack. If you find yourself in this situation then graph projections can be a solution for you, so let's dive into it.
In our example, we will use a graph generated from the jQAssistant Maven plugin that can turn any Java codebase into a detailed graph using abstract syntax trees and other techniques. Our graph has circa 30.000 nodes and 70.000 relationships. It's not big but it's big enough to run into the "needle in a haystack" issue. To show how a graph projection can help with this we will explore two of them:
To automate the process of creating and maintaining a graph projection we will use Graphlytic's embedded Jobs module where a job will be recreating the projections on demand (can be also scheduled to be executed after every data import into the main graph, never leaving you with an outdated projection).
For creating the projections we will use plain Cypher without using the great APOC library, just to make things clearer and simpler. Of course, queries in this example has their limits and I would not recommend using them on substantially bigger graphs than several hundred thousand nodes and relationships. In such a case please contact us and our support team will help you with the queries for your particular case.
Another great feature of this approach is that no matter how big the projection is, it's stored in the knowledge graph as a separate, disconnected subgraph (graph component) and this subgraph can be explored, searched and visualized just like any other graph, meaning all the Graphlytic's features like double-clicking to expand or finding the shortest paths are working out-of-the-box.
When working with an automated graph it's always a good idea to take a look at the graph schema. By graph schema in this example I mean a graph projection where every "type" of node is represented with one node and every "type" of relationship is represented with exactly one relationship. Similar projection can be shown in Neo4j by running "CALL db.schema.visualization()" or using the APOC schema procedures.
In our example, you will see that the Cypher query used to create the schema projection can be easily altered to create a schema where properties (instead of node labels and relationship types) can be used to map the elements to "types" and you can also compute different aggregated values to enhance your schema.
To create the projection we need two Cypher queries. The first one will create nodes:
MATCH (n) WITH labels(n) as labels, COUNT(n) AS numOfNodes
CREATE (n:SCHEMA {schema_type:labels, numOfNodes:numOfNodes})
The second one will create relationships:
MATCH (a)-[r]->(b)
WHERE NOT "SCHEMA" IN labels(a)
WITH DISTINCT labels(a) as aLabels, type(r) AS rType, labels(b) AS bLabels, COUNT(r) AS numOfRels
MATCH (aSchema:SCHEMA {schema_type:aLabels}), (bSchema:SCHEMA {schema_type:bLabels})
CREATE (aSchema)-[r:SCHEMA {schema_type:rType, numOfRels: numOfRels}]->(bSchema)
Running these two queries will create a subgraph where every combination of node labels and every relationship type will be represented with one SCHEMA element with the number of "merged" elements saved as a property on the SCHEMA element.
The result is that a visualization that looks like this:
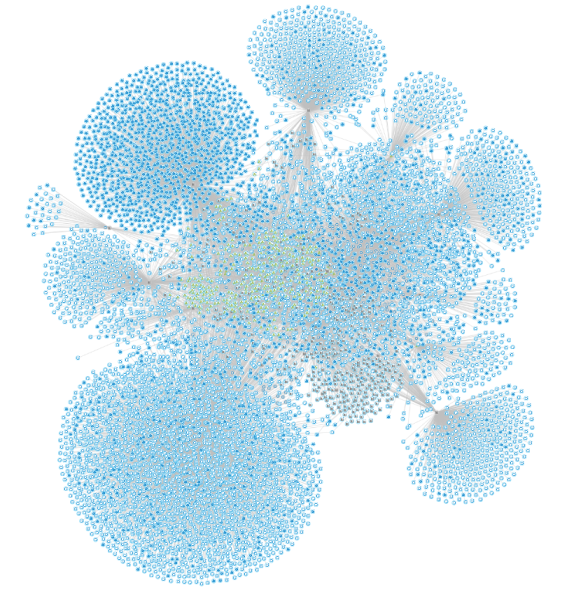
Is boiled down to types of relationships between types of nodes:
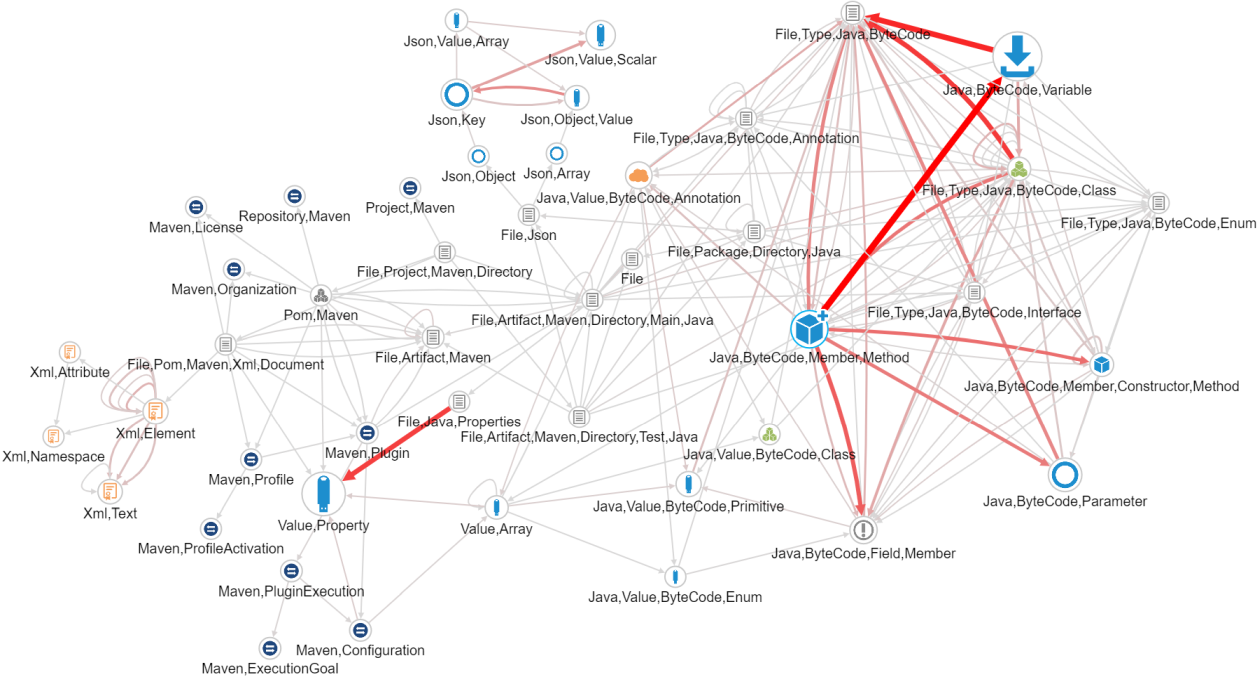
Now let's take a better look at two types of nodes in the schema - Classes and Methods. In static source code analysis, the relationship between classes in the sense that "methods of this class are heavily calling methods from this class" can be very valuable. Whether it's refactoring a big module or looking to replace a particular technology, chances are that projection of relationships between classes itself (without the method granularity) is the first thing that you would like to see before taking any action in the code.
In the schema projection above the classes and their relationships I'm talking about are these:

The numbers in the brackets are the counts from the main graph created in the schema projection as "numOfNodes" and "numOfRels". From this simple visualization we can clearly see things like:
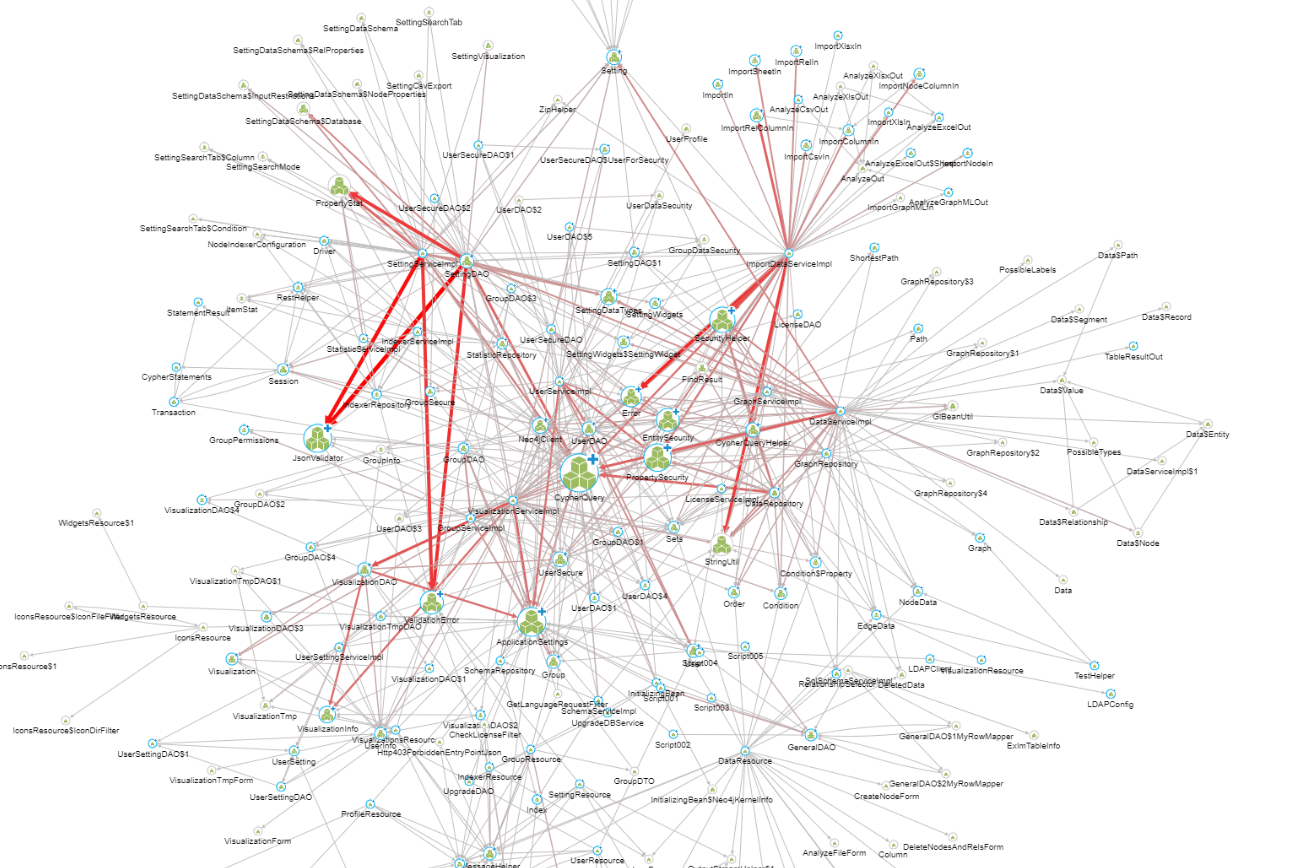
From these numbers, one can feel that the relationship between classes themselves will be hidden behind a wall of neverending method calls. And that's exactly how it is (the blue icons are methods and the green icons are classes):
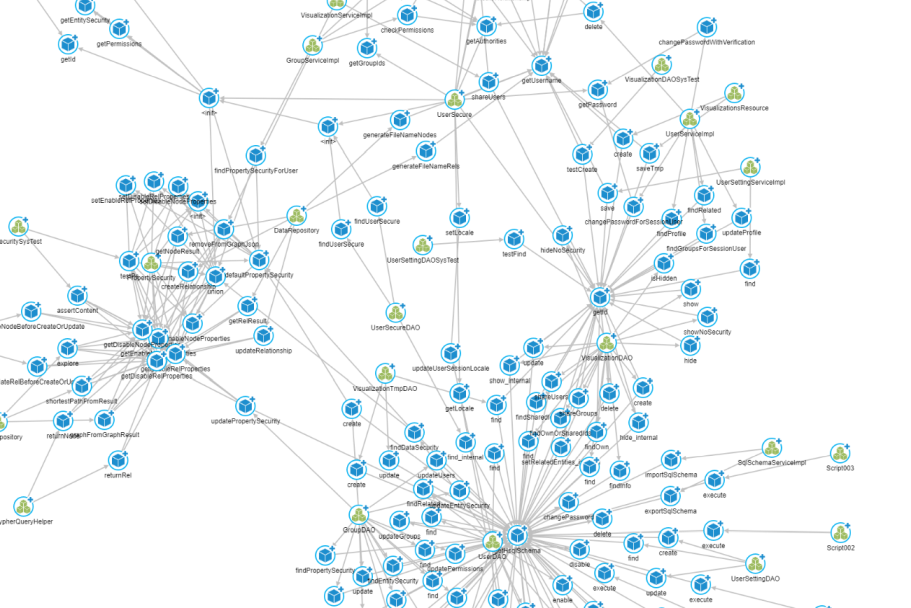
To infer the relationships between classes we will use a simple projection that will match all paths between classes using DECLARES and INVOKES relationship types. To establish which class is using which other classes our logic will be - if a method declared by class A is invoking a method declared by class B then class A is "using" class B and we will create a relationship from class A to class B in our projection.
The Cypher query to create the projection is as follows:
MATCH (a:Class)-[r1:DECLARES]->(b:Method)-[r2:INVOKES*1..10]->(c:Method)<-[r3:DECLARES]-(d:Class)
WHERE id(a) <> id(d)
WITH a, d
MERGE (c1:CLASSES {class:a.name})
MERGE (c2:CLASSES {class:d.name})
MERGE (c1)-[cr:CLASSES]->(c2)
ON CREATE SET
	cr.num = 1
ON MATCH SET
	cr.num = cr.num + 1
After playing with the styling of the result we can quickly start to see which classes are in the core of our codebase and which are just supporting a peripheral part of the application. Using the counts created in the projection together with Graphlytic's virtual properties can quickly reveal the relative importance of particular classes in our code.
The ~ 3.500 nodes and 15.000 relationships from the main graph have been reduced to ~ 300 nodes and 900 relationships, which is much dense information and can give us particular answers much faster than looking into the original graph.
To make things easier it's possible to put all queries into one job that will create the projections with one button.
Graphlytic's Job is an XML file with steps that will be run in the order in which they are defined in the job. This job can be then used in Graphlytic and can be run on-demand or scheduled to be executed at specified intervals.
<!DOCTYPE etl SYSTEM "http://scriptella.org/dtd/etl.dtd">
<etl>

    <description>Graph Projection</description>

    <connection id="neo4j" driver="neo4j" url="http://localhost:7474/" user="neo4j" password="admin"/>

    <!-- SCHEMA Projection - Create nodes -->
    <script connection-id="neo4j">
        MATCH (n) WITH labels(n) as labels, COUNT(n) AS numOfNodes
        CREATE (n:SCHEMA {schema_type:labels, numOfNodes:numOfNodes})
    </script>

    <!-- SCHEMA Projection - Create relationships -->
    <script connection-id="neo4j">
        MATCH (a)-[r]->(b) WHERE NOT "SCHEMA" IN labels(a)
        WITH DISTINCT labels(a) as aLabels, type(r) AS rType, labels(b) AS bLabels, COUNT(r) AS numOfRels
        MATCH (aSchema:SCHEMA {schema_type:aLabels}), (bSchema:SCHEMA {schema_type:bLabels})
        CREATE (aSchema)-[r:SCHEMA {schema_type:rType, numOfRels: numOfRels}]->(bSchema)
    </script>

    <!-- Create CLASSES Projection -->
    <script connection-id="neo4j">
    <![CDATA[
        MATCH (a:Class)-[r1:DECLARES]->(b:Method)-[r2:INVOKES*1..10]->(c:Method)<-[r3:DECLARES]-(d:Class)
        WHERE id(a) <> id(d)
        WITH a, d
        MERGE (c1:CLASSES {class:a.name})
        MERGE (c2:CLASSES {class:d.name})
        MERGE (c1)-[cr:CLASSES]->(c2)
        ON CREATE SET
            cr.num = 1
        ON MATCH SET
            cr.num = cr.num + 1
    ]]>
    </script>

</etl>
To run it just go to the Jobs page in Graphlytic and:
In case you need to run it multiple times a new script can be added into the job that will delete all projections before generating the new ones.
Contact us if you want our help with setting up the environment for your project, our support team is ready to help you with the journey.
