The 'Aha!' moment or eureka moment (also known as insight or epiphany) refers to the common human experience of suddenly understanding a previously incomprehensible problem or concept. The effect is taken from a story about the ancient Greek polymath Archimedes who discovered how to measure the volume of an irregular object while being in a public bath. When he made this great hydrostatics discovery, Archimedes allegedly jumped out and ran home naked shouting eureka, "I have found it!".
Virtually all property graph users from time to time experience the Aha! moments when visualizing graphs. Why? Read more to find out.
In this article we'll dive deeper and will walk you through the following topics:
Before we jump to the first part, please note and follow this instruction:
Be aware! When working with property graphs you might get a nanosecond of deep insight, also known as the Aha! moment. No matter when, and how many times this occurs, please do not run naked in public!

As the human eye instinctively captures patterns within the graphs, complex networks visualized as graphs are naturally easier to comprehend than data sorted in the form of spreadsheets or reports. This fact brings deep insights or 'Aha!' moments to users manipulating the data in the node edge graph visualization.
Faster action due to much better comprehension and quicker absorption of knowledge into the mind, as the human brain is able to incorporate visual information much faster than just text or numbers.
Interactivity within the graph visualization is the essential benefit to satisfying human desires to explore, search for, and find patterns that bring fresh insights; and the creativity to define specific ones.
Graph visualization is an effective way to share ideas or insights to spread knowledge or to support the decision-making process.
The best network graph visualization tools provide a user-friendly environment for any kind of user - no need for technical background.
Synonyms for graph visualization are simplicity and effectiveness. You can easily use a whiteboard to simply draw the data model. Just draw a diagram with bubbles or squares for entities and arrows for relationships. A draft of the data model can be then directly incorporated into the graph database.
Note: Read more in Graphlytic Concepts if you want to know more about the graph terminology we are using in this article.
A property graph is a network of nodes and directed relationships among these nodes. Generally, anything that could be drilled down into a set of data records that have relationships, or links within the set can be represented as a graph.
This kind of data interpretation brings insights into use cases where connections are important in various industries. In the article below (see Point 3. What kind of puzzle are you working on?) we'll introduce several domains where graph visualization tools are highly beneficial.
A 'Node', or a 'Vertex' is a data record within a graph that represents any entity you can think of (a person, a movie, an address, or a transaction). Nodes may have 'Labels' that group nodes together into smaller groups of named subsets.
A 'Relationship' or an 'Edge' is directed and precisely connects two nodes - a start node and an end node. 'Relationship type' marks a relationship as a member of a named subset. Both nodes and relationships incorporate zero to an arbitrary collection of properties.
The main purpose of a 'Property' is to store information. A property is a key-value pair, consisting of a name and a value attached to that name, saved in a node or relationship.
Let's introduce this basic graph concept with the help of a simple schema from 'The Big Bang Theory' series written down on the whiteboard.
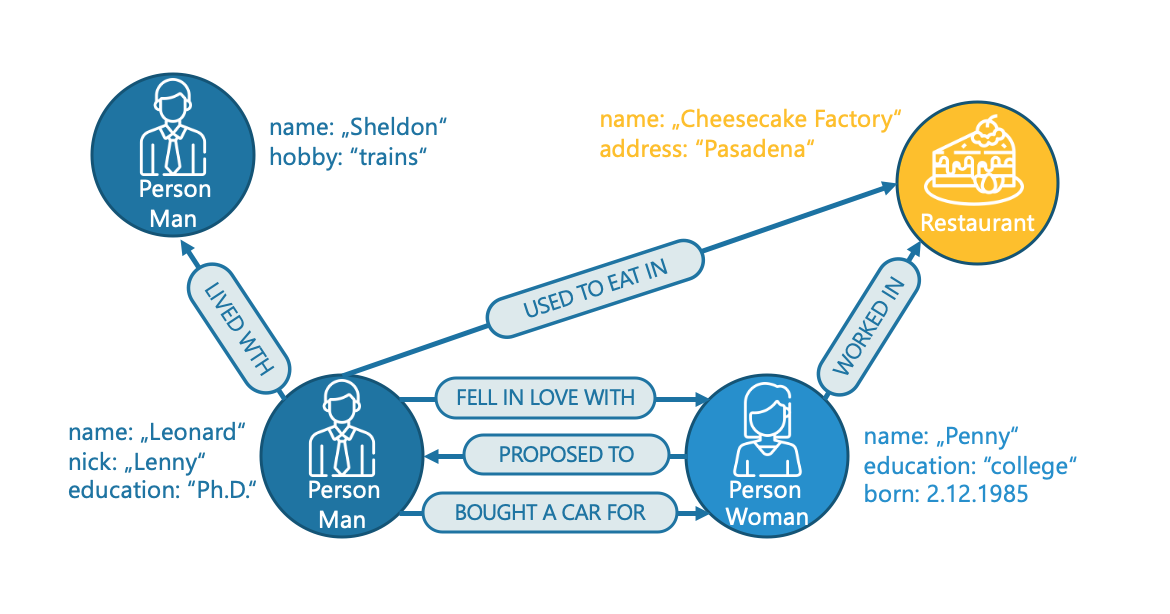
In our example, we have 4 nodes. Two of them are labeled as a 'Person', and the third is labeled as a 'Restaurant'. Due to their second label nodes with the label 'Person' are divided into smaller subgroups - 'Man', 'Woman'. So, based on these labels we have 3 different types of nodes.
Every node contains a certain set of properties to further define the data in the graph. For example, the node with the labels 'Person' and 'Man' has a name property 'Leonard' with a nickname property 'Lenny', and an education property 'Ph.D.'. The second node labeled as 'Person' and 'Woman' has the same two properties as the first one - the name and the education, but with different values - 'Penny' for the name, and 'college' for the education. All properties that we mentioned so far have a type of string (= text) value. The third property for the "Penny" node is the born property.
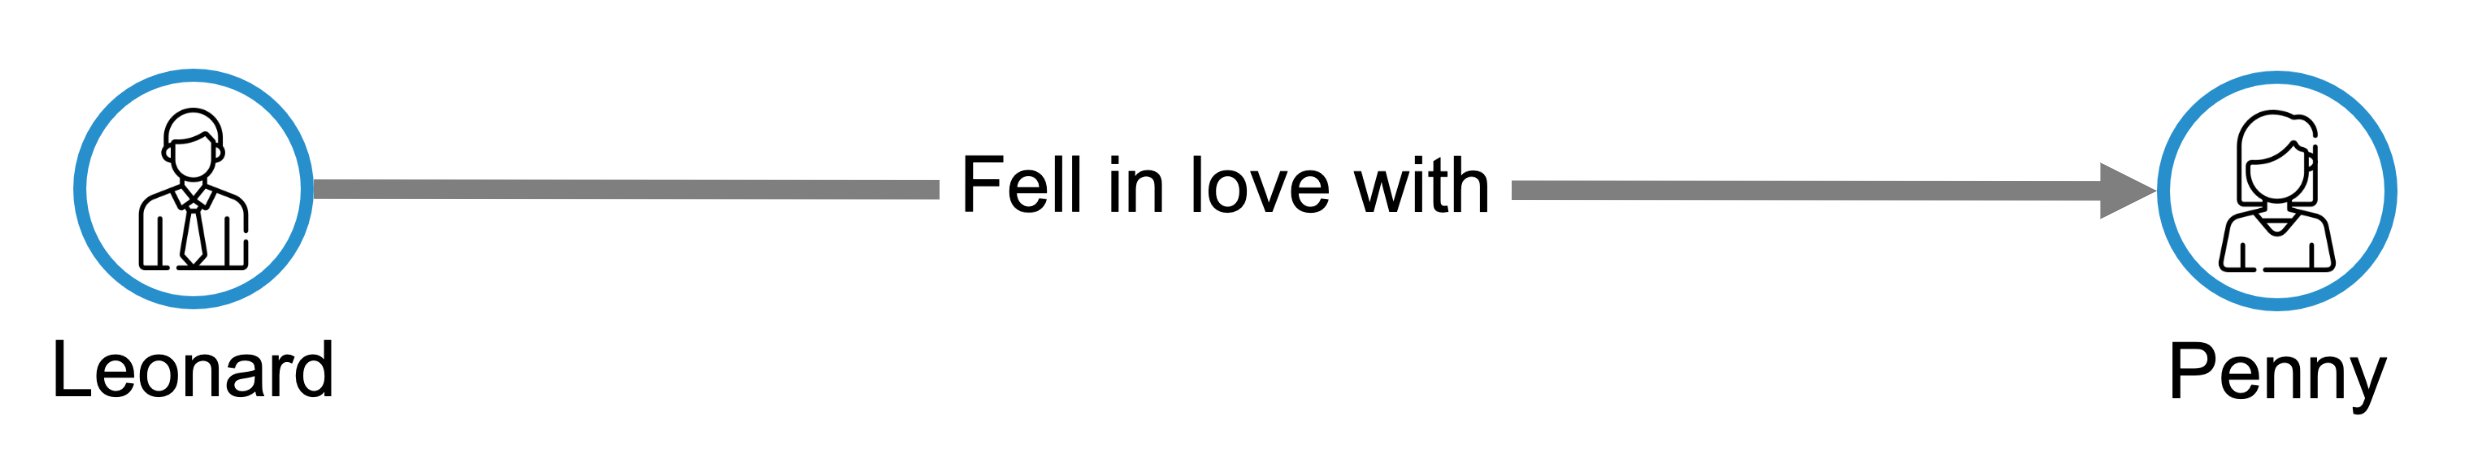
For explanatory purposes, let's focus solely on the relationships between "Leonard" and "Penny". There are 2 directed relationships heading from "Leonard" to "Penny" with relationship types of 'fell in love', and 'bought a car for'. There is 1 directed relationship from "Penny" to "Leonard" that indicates that Penny proposed to Leonard.
Graph visualization is used to visualize and analyze graph data - a network of nodes and relationships. Algorithms in the background calculate the positions of nodes and visualize them on the user's display as two- or three-dimensional representations of a graph.
Graph visualization applications provide an interactive interface for users to explore graph data. The best network graph visualization applications like Graphlytic bring an easy-to-learn web interface where users can:
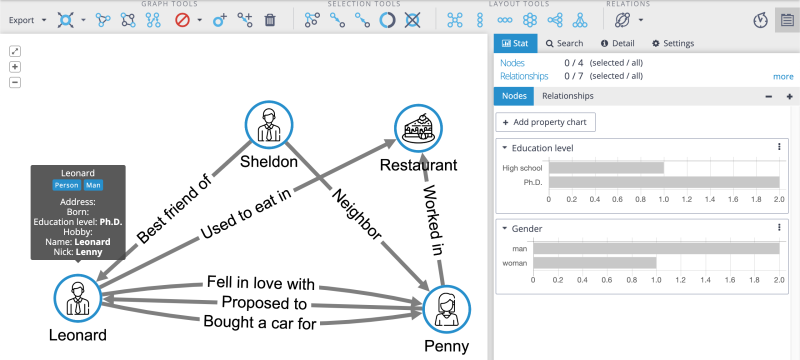
Let's stick to our simple example from The Big Bang Theory and transfer a whiteboard draft into the Graphlytic graph visualization. This is the resulting graph:
The graph elements are stored in a graph database. A graph database is a set of nodes, relationships between those nodes, and the attached labels, types, and attributes. In comparison to traditional databases that put data in tables with rows and columns, the graph database has a flexible structure.
Graphlytic can be connected to multiple graph database products and platforms, e.g.
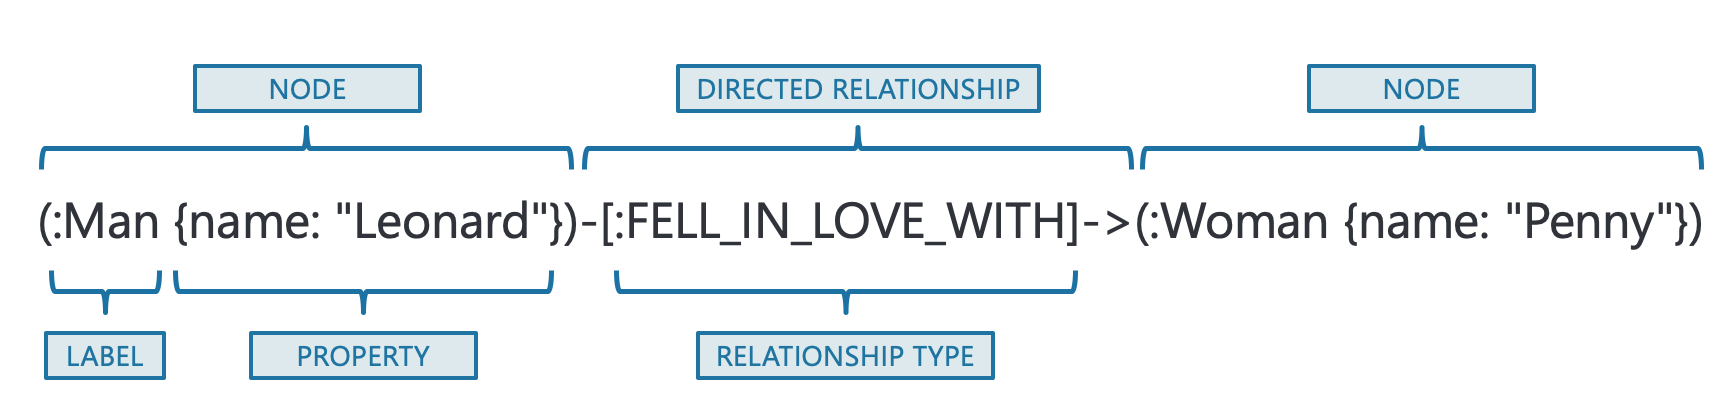
Cypher is a declarative query language, developed by Neo4j to query the graph database. The Cypher allows for expressive and efficient querying and updating of graph data. It is designed to be a human-friendly query language constructed to use iconography (called ASCII Art) to make queries more self-explanatory. The main benefit of Cypher compared to SQL is in writing statements with a large number of JOINs. Cypher uses the following basic syntax:
Now, let's come back a bit to our whiteboard model to introduce the simple relationship between "Leonard" and "Penny" in Cypher.
This is a whiteboard draft of a strong emotion called love transferred into Graphlytic interface:
This is the same relationship written in Cypher query language.
As mentioned above we can use Cypher to query or update the graph database or visualize the graph. The definition of patterns and the ability to query in the graph are the most powerful advantages of using the Cypher language.
Example of a query that can be described as "find all men that fell in love":
MATCH (m:Men)-[r:FELL_IN_LOVE_WITH]->(w:Woman) RETURN m
Here are just a few examples of where node edge graph visualization brings a ton of benefits for users.
The operations of large IT networks
Complex data networks with an enormous number of elements (such as racks, servers, databases, and services) need adequate support. All these components are highly interconnected and mutually dependent. Graph visualization tools support companies with network documentation, network configuration management, impact analysis, asset management, and total costs of ownership management. But not only this, graph visualization analysis helps unearth bottlenecks inside the network, assists in the planning of the outages, and their prevention.
More on the topic in IT Infrastructure Graph Visualization use-case description.
Fraud detection and prevention
As well as its well-documented advantages in banking and insurance, graph visualization can be used in any industry using e-commerce. The graph visualization application is an ideal support tool for traditional anti-fraud and risk management tools to increase the ability of the business unit to detect and prevent significant financial losses caused by sophisticated and well-organized fraud rings.
Pain points of fraud detection and prevention efforts and the benefits of visualizing graphs in fraud-fighting are well described in our separate use case: Fraud Detection And Analytics Enhancement.
Cybersecurity
Graphy visualization tools are pretty useful in this field as well. Importing log data from network devices standing in the first line (such as firewalling, routing, and managed switching devices) into the graph database followed by the analytics in the graph visualization tool can again unveil certain schemas of the performed or potential cyber attack. By having insights into how things are organized, network security officers can better apply the policy and procedures to decrease network vulnerability.
Enterprise Communication Analysis
Enterprise communication and collaboration analysis are based on the fact that an enterprise is a living unit. This enterprise has its own patterns of internal and external communication and collaboration. These changes over time. On the one hand, in every organization, there is for sure space for improvements in this area. On the other hand, not only do communication improvements count, but also some preventive measures are to be applied when the unit is hit by internal or external changes (such as personnel changes in the department, management replacement, changes in internal processes, or switch of external partner) to avoid disruption in existing processes of communication.
Graph visualization and analysis of various communication logs (such as call logs, e-mail logs, and internal chat logs) bring a unique pattern that clearly illustrates the bottlenecks, desired communication streams, or changes over a defined period. For more on how to do it, please, read our use-case Enterprise Communication Analysis. You'll again find the pain points of internal and external collaboration and the benefits that enterprise communication visualization brings.
For more use cases such as Process Analysis, Scientific Research, or Software Source Code Refactoring check out our focused Top 7 Graph Use Cases for 2020 blog post.
We at Graphlytic help our clients get better business insight by connecting the dots and unveiling patterns in their highly interconnected data. Our ultimate aim is to enable all teams of analysts to quickly and collaboratively use their graph data with no coding required.
Graphlytic is available as:
Request a Free Trial here.
Demtec, s.r.o.
Karpatské námestie 10A
831 06 Bratislava
Slovakia
ID: 47807890
VAT ID: SK2024104434
EMAIL: info@graphlytic.com
TEL: +421 944 289 809