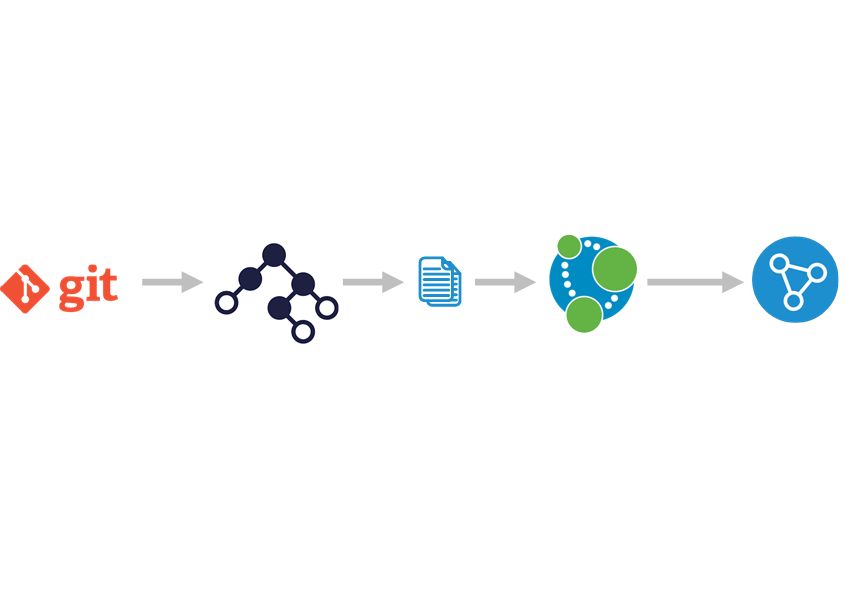
Graph visualizations are a perfect tool to analyze the structure of any computer program. The power of graphs can be leveraged to move from tree structures to more "alive" graph structures. Using these structures, you will be able to interactively and intuitively explore your code to unveil and remove unwanted or “forbidden patterns”.
The process is pretty much the same for any programming language and it follows these steps:
Note: The same process starting with step 2 can be used for generating graphs from any source. If you are able to generate the CSV files from your HW models then it’s possible to visualize them using Graphlytic.

Every language compiler or interpreter is using AST as the first step in compiling or code checking. There are multiple free libraries for every major language that can turn your codebase into AST in seconds, for instance:
AST libraries for C++
After few minutes of googling you can stumble on - for instance:
For JavaScript it is possible to use the Type Checker in TypeScript: https://github.com/Microsoft/TypeScript/wiki/Using-the-Compiler-API#using-the-type-checker
There is a good article from Uri Shaked on using the AST in JS for type checking that can be used as a starting point to get the AST structure of your code: Diving into the Internals of TypeScript: How I Built TypeWiz
When you have the AST ready it’s quite easy to write a small program that will recursively traverse the AST and based on your graph model generate 2 datasets. The hard part is to define the graph model that you want to end up with. It’s a balance between the level of detail and the readability of the graph. Also, it has to be constructed based on what you want to “see” in the graph. The best way is to start with a blank whiteboard where you sketch a small graph of one part of your system. This can greatly help to organize your thoughts about what should be modeled as nodes and what should be modeled as relationships.
The typical graph models for code refactoring/analysis have multiple types of nodes and levels of relationships, e.g.:
Our experience is that it is the best to start with a small graph, like methods and their calls, and then add next levels (like API calls) in the next iterations. Every iteration should go all the way from codebase to Graphlytic visualization.
The resulting datasets should be 2 simple CSV files – this is the easiest and most used format for import into Neo4j using Graphlytic’s Jobs.
Structure of the CSV’s is very simple:
Example of such datasets (but in Excel format) can be seen for instance in this blogpost: How The Big Bang Theory Inspired Us To Blog About Manual Import To Graphlytic
Other examples can be found in the ETL examples in our documentation: ETL Documentation - CSV to Neo4j
When you have the CSV the import process is quite simple. We highly recommend using Graphlytic’s jobs. It’s a simple XML file with few steps. The advantage is in recurrent use or scheduling of the jobs (write one, use multiple times – especially when you are still creating the “best” graph model for your use case).
We can help you with writing the first job, or you can look into the examples mentioned here: ETL Documentation - CSV to Neo4j
When you have the data in Graphlytic you can start with the visualization, looking for patterns using the Cypher language, writing Jobs that will automatically check for any model inconsistencies or “forbidden patterns”, share visualizations with other users, export images or datasets, …
With Graphlytic Enterprise it’s possible to create multiple user groups where the users will have different permissions. One group can be the “data admins” that will update data in the graph. Other groups can be in “read-only” mode or even can have restricted access and see only parts of the graph.