IT infrastructure demo is based on an anonymized dataset of a Configuration Management Database (CMDB) which is in heart of every IT infrastructure management framework (e.g. ITIL or other). CMDB typically holds information about every entity of an IT network and most importantly information about relationships between these entities. The power of Graphlytic is in general network visualization capabilities where all relationships together can provide a comprehensive picture of the infrastructure.
Graphlytic is a link visualization and analytics tool and it can be used with any type of infrastructure, whether you want to create an AWS infrastructure visualization, custom cloud infrastructure visualization, or a network visualization in general.
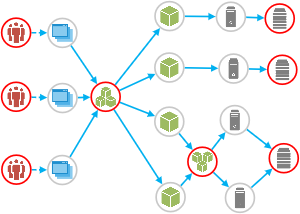
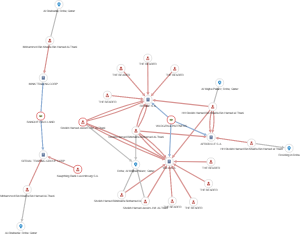
The example in the picture below shows one of the virtualization clusters in the CMDB database. The cluster's HW is spread across two Racks and multiple Physical Servers. Virtual Managers (e.g. VMware) installed on these servers are then splitting the HW resources into multiple Virtual Servers which then hosts applications or databases (not pictured).
Other graph visualisation in the demo
Cluster visualization
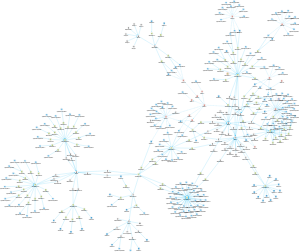
A larger cluster of nodes showing how multiple services can share the same hardware resources.
Compact view
View of a specific cluster showing entity relationships in detail.
Top 3 HW Platforms
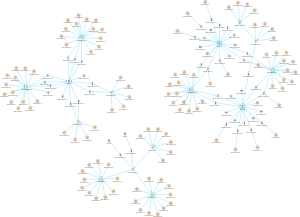
Shows the three largest HW platforms in the database. From racks to virtual servers and network devices in one picture.
Create a graph visualization with some nodes and explore their relationships - double click on a node to read all relations of that node from DB and add them to the graph visualizationSave created graph visualization to your visualizations in the project
Statistics: play with property histograms in graph visualization - select element categories
Virtual properties: create virtual properties (custom formulas) on nodes and relationships with JavaScript
Find the shortest path: select 2 nodes (Shift+Click) and press the "Find shortest path" button in the top toolbox to calculate the shortest path (calculation is done in DB and new elements are added to the graph visualization if needed)
Graph visualization styling: create styling mappers in the "Settings" tab to style the graph visualization according to data to highlight patterns
Layout: use one of the layouts in the toolbox to automatically rearrange the graph visualization (layout is applied only to the selected part of the graph visualization or to all elements if nothing is selected)
Image and data export: use one of the export options in the "Export" dropdown menu or export CSV data or image of the graph visualization
Online demo
PANAMA PAPERS
Visualisation of the leaked Panama Papers documents
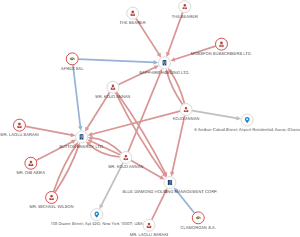
"The Panama Papers are 11.5 million leaked documents that detail financial and attorney-client information for more than 214,488 offshore entities. The documents, some dating back to the 1970s, were created by and taken from, Panamanian law firm and corporate service provider Mossack Fonseca, and were leaked in April 2016." WikipediaThe graph visualization of the Panama Papers in Graphlytic brings to life metadata and relationships between entities extracted from the leaked documents. The database was downloaded from the ICIJ download page.
The graph model has multiple entity types, and the fulltext search is set to look into names, countries, and addresses. It's very easy to start with a name that will probably match an Officer or Entity (company). You can then easily explore relationships in the graph to see which Intermediaries were between the Officers and Companies.
Other graph visualisation in the demo
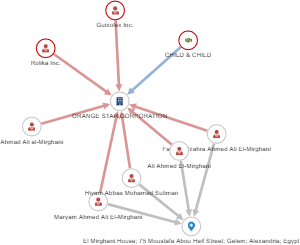
Ahmed al-Mirghani
Sudanese president Ahmed al-Mirghani, who was president from 1986-1989 and his business associates.
Hamad bin Khalifa Al Thani
Former Emir of Qatar Hamad bin Khalifa Al Thani owned Afrodille S.A. and shares in Rienne S.A. and Yalis S.A.
Kojo Annan
Kojo Annan, the son of former United Nations Secretary-General Kofi Annan and his business relationships.
Create a graph visualization with some nodes and explore their relationships - double click on a node to read all relations of that node from DB and add them to the graph visualizationSave created graph visualization to your visualizations in the project
Statistics: play with property histograms in graph visualization - select element categories
Virtual properties: create virtual properties (custom formulas) on nodes and relationships with JavaScript
Find the shortest path: select 2 nodes (Shift+Click) and press the "Find shortest path" button in the top toolbox to calculate the shortest path (calculation is done in DB and new elements are added to the graph visualization if needed)
Graph visualization styling: create styling mappers in the "Settings" tab to style the graph visualization according to data to highlight patterns
Layout: use one of the layouts in the toolbox to automatically rearrange the graph visualization (layout is applied only to the selected part of the graph visualization or to all elements if nothing is selected)
Image and data export: use one of the export options in the "Export" dropdown menu or export CSV data or image of the graph visualization