Required Permission: Export data (Read more about permissions in Project Settings)
Table of Contents
Data can be exported into a CSV file which can be opened in Microsoft Excel and other editors of tabulated data.
Exported attributes and column names can be configured (see CSV export).
1. Export CSV from the Queries page
Main menu (top right) - Queries page.
Choose a "Node Filter" type query.
Enter search criteria to search for a set of nodes.
Press the "CSV export" button. The number of maximum exported rows can be configured by the admin.
The system window "Save File" is opened. Browse and save the file to your local disk.
2. Export CSV from Visualization
Open a visualization.
Select elements you want to export (if nothing is selected then all elements from the visualization will be exported).
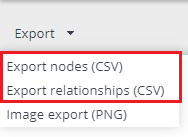
Open menu "Export" on the left side of the top panel (shown in the image below).
Press "Export nodes (CSV)" or "Export relationships (CSV)".
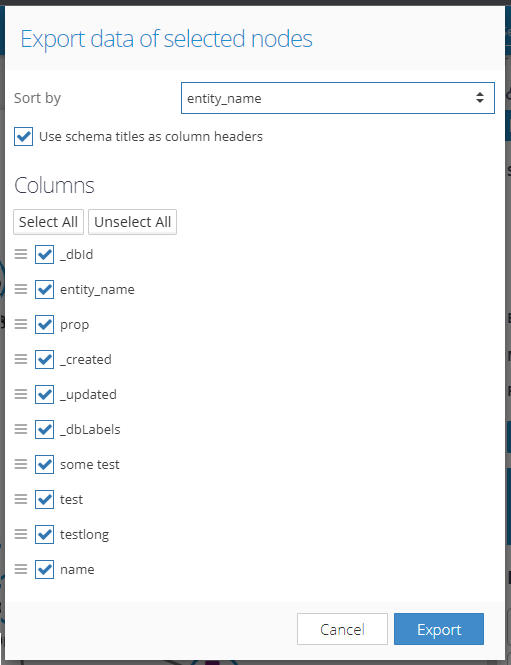
The Export modal window is shown (shown in the image below). Here, it's possible to choose:
which properties will be exported,
the sorting property (the list includes also the "Detect Path" sorting which tries to find the longest path in the exported data and sort the elements according to the path),
whether the technical property names should be used as the column header titles, or ich the Data Schema defined titles should be used.
Window "Save File" is shown. Browse and save the file to your local disk.
Export menu in the Visualization:
Export modal window in the Visualization:
3. Export a static image of the graph
Open a visualization.
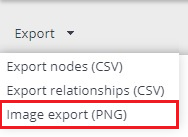
Open the menu "Export" on the left side of the top panel (shown in the image below).
Press "Image export (PNG)".
Window "Save File" is presented. Browse and save the file to your local disk.
Note: The final image contains not only the visible part but the whole graph.


