Table of Contents
Every project has a separate set of settings and user permissions that can be managed using the Project Settings page.
Graphlytic works without any special settings after connecting to a supported graph database. The only thing you have to set is the fulltext index (if you want to be able to use the search functionality). It's just a few clicks. More information and steps on how to set up the fulltext index can be found in the Search Settings.
1. Opening the Project Settings page
The Project Settings page can be opened in multiple ways:
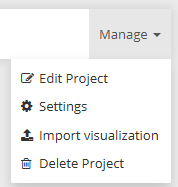
1.Using the "Settings" option in the project's "Manage" menu (on the Projects page):
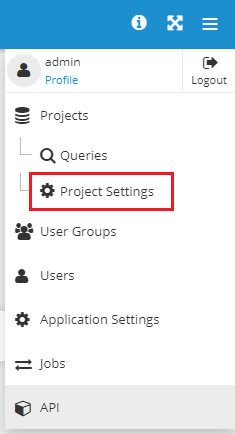
2.Using the "Project Settings" option in the Main Menu:
2. The layout of the Project Settings page
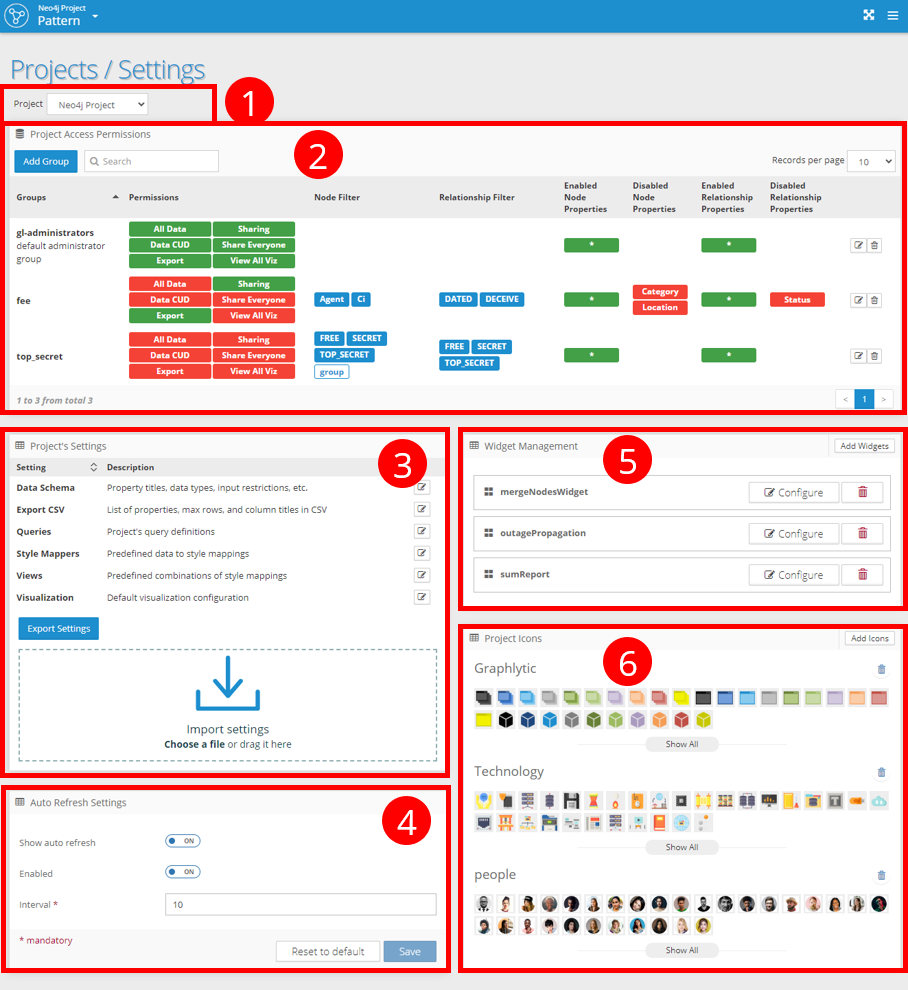
The Project Settings page consists of multiple panels used for different purposes. Shown in the picture below are:
(1) Project switch - used to switch between projects.
(2) Project Access Permissions - management of data access of various user groups in the project.
(3) Project's Settings - project-specific settings like queries, data schema, styles, etc.
(4) Auto-refresh Settings - enable/disable the auto-refresh feature in visualizations.
(5) Widget Management - add/remove/configure custom widgets in this project.
(6) Project Icons - add/remove custom icon groups available in visualizations in this project.
2.1. Project Switch
To switch between settings of various projects, use the project switch (#1 in the picture above).
2.2. Project Permissions
This panel (#2 in the picture above) allows adding or removing user groups from the project. Only users from assigned groups can access data in the graph.
Access permissions allow users to control how they access the data. There are three main groups of access permissions (see description in the following chapters):
(1) Application Permissions
(2) Property Security
(3) Entity Security
2.2.1. Application Permissions (1)
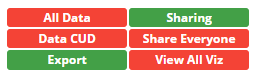
Application permissions set for a user group are shown in the "Permissions" column in the panel. These permissions allow you to turn on/off certain features like sharing or exporting data.
When particular permission is granted to a user group, the permission is displayed as a green pill, and when the consent is revoked it's a red pill:
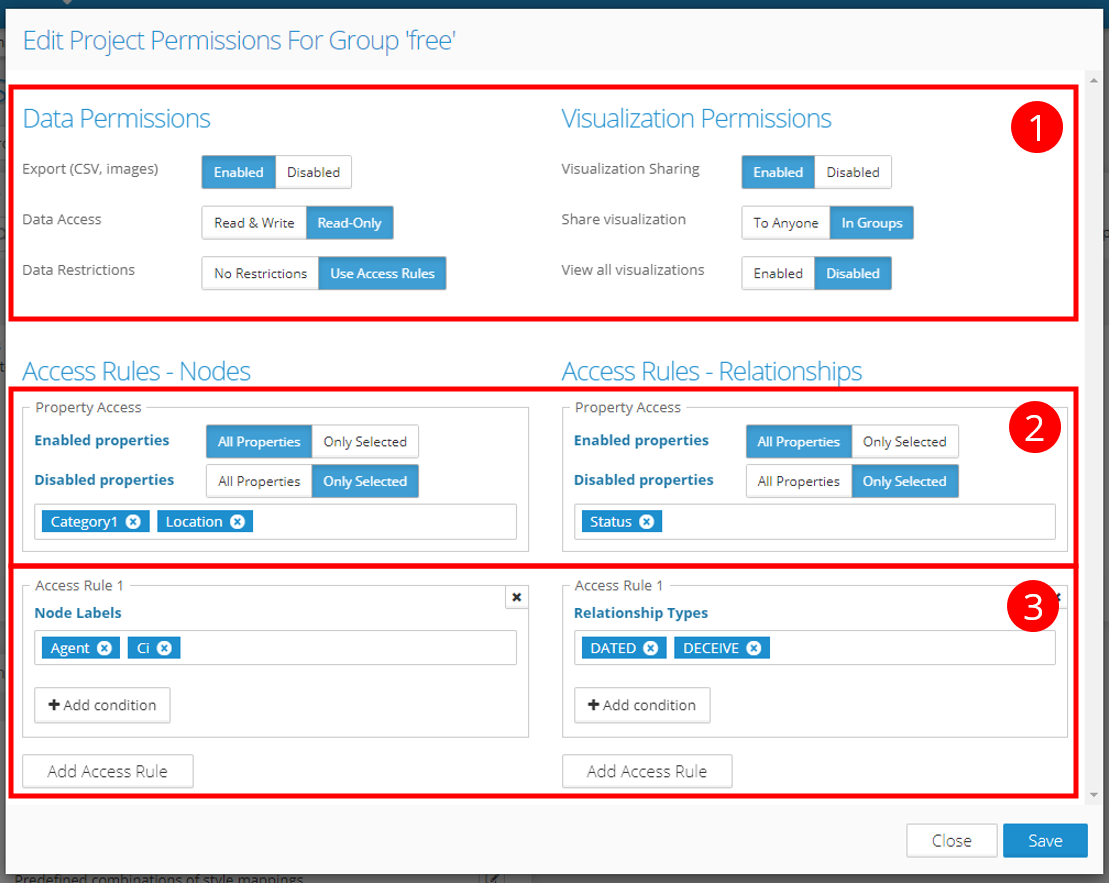
To change the application permissions for a group in a project, edit the corresponding mapping (by clicking on the "Edit" icon in the right column). The application permissions are located in the first part of the modal window.
Application permissions can be used to control users' access to various features (see the following table for more details).
Permission title in the configuration window | Short title in the summary table | Description |
|---|---|---|
Export (CSV, images) | Export | Allows data and images to be exported from the application. |
Data Access | Data CUD | "Read&Write" or "Read-only" to disable the option to create or modify graph data. See Create, update, delete data for more details. |
Data Restrictions | All Data | "No Restrictions" for full access or "Use Access Rules" to limit the access to the graph. When set to "Use Access Rules", additional parts (2) and (3) are shown in the modal window. Check the following chapters for details and examples of configuration of access rules. |
Visualization Sharing | Sharing | Turning on/off the sharing feature. Users with this permission can share visualizations:
More info can be found in the User Manual - Projects |
Share visualization | Share Everyone | Use "To Anyone" to allow visualizations to be shared with all project users, or "In Groups" to allow users to share only with other users in their groups. |
View all visualizations | View All Viz | Users with this permission can see all visualizations in the project (used for admins or in smaller teams to increase the flexibility of collaboration). Users without this permission can view only visualizations they created or are shared with them. |
2.2.2. Property Security (2)
With Property Security, enabling or disabling specific properties for user groups in the project is possible. The rules are based on two lists of properties:
Enabled properties - if a property is listed in this list, it's enabled unless it's disabled (listed in the disabled properties list).
Disabled properties - if the property is listed in this list, it's disabled, and no user from this group can access the data stored in it.
A few notes about the rules:
If the property is listed in both lists (enabled and disabled), the property is disabled.
If the user is a member of multiple groups and a particular property is disabled in one group's permissions and enabled in others, then the property is enabled for the user.
2.2.3. Entity Security (3)
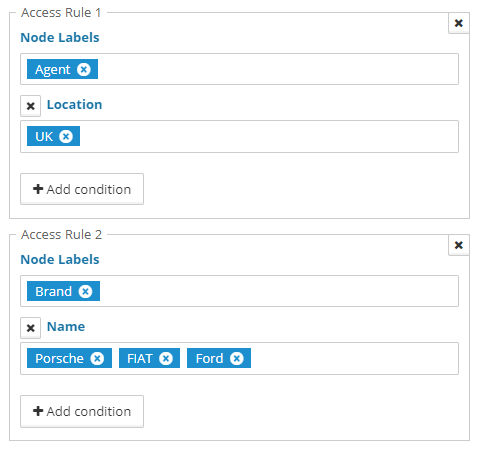
Entity Security allows graph access to be limited for a group of users. Using Access Rule stacking, it's possible to define multiple enabled areas in the graph, and the final accessible part of the graph will be the union of the parts defined in the rules. Every Access Rule consists of:
Node Labels or Relationship Types - list of labels/types this rule allows.
Property conditions - list of properties and their values that will be allowed by this rule. If multiple property values are listed then all of them are allowed (logical OR).
For example, let's imagine we have a graph of Agents in car dealerships selling different car Brands and want to access the data for an office managing UK dealerships for three specific car brands. We can do this using two Access Rules - one restricting the Location of Agents and the other limiting the Brands (shown in the picture below).
2.3. Project Settings
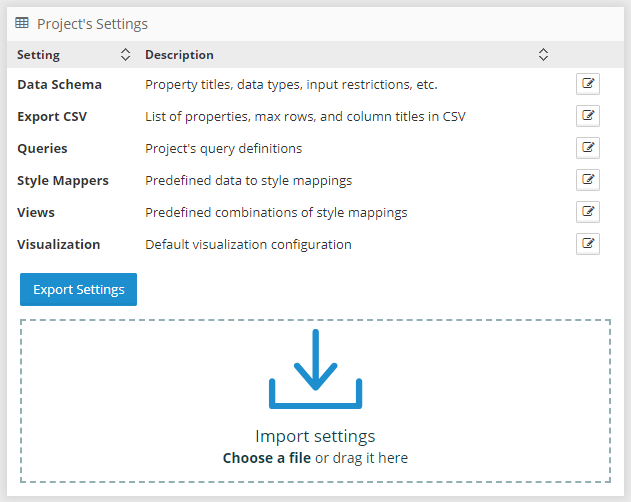
Project settings (pictured above) allow users to export and import all project-scoped settings in one place. Most settings are managed in a user-friendly way in various panels on the Project Settings page, in the visualization, or on the Queries page. This panel is mainly for the convenience of exporting and importing all settings in one zip file.
To export the project settings, click on the “Export Settings” button. This will download a zip file containing all settings in separate JSON files.
To import the settings, use the Import drag-and-drop panel or locate the file manually using the “Choose a file” link. You can import the whole zip file, a zip file containing only some of the JSON files, or a single JSON file. The name of the JSON files has to be unchanged because the name is used to determine which configuration is being imported.
Find details about specific setting options in the following chapters:
- CSV export
- Queries Setting
- Widgets
- Data Schema
- Custom Icons
- Visualization Settings
- Views
- Style Mappers
- Query Libraries
2.3.1. Visualization default settings
Some of the project settings can be used to set the default configuration of every newly-created visualization:
Data Schema - use Data Schema to format property values (decimal places, currency symbols, or date formats), create global virtual properties, or define input restrictions for graph editing use cases.
Visualization - default settings for any newly-created visualization. Default style mappers, titles, tooltips, thresholds, and much more can be changed in this setting.
Optional but highly recommended is to define Style Mappers. Style Mappers objects are used to define rules for visually mapping the data in the graph to style properties like icons, colors, sizes, etc. Created style mapper objects are listed in the "Style" tab in visualization, where you can apply them to style the visualization.
The Visualization and Style Mappers settings can be set with one click from any Visualization - the "Save as default visualization configuration" button is at the bottom of the Settings tab. First, style the visualization as you like and then save the settings with the button. After that, any newly created visualization will use the same configuration as a default configuration on initialization.
2.4. Auto-refresh
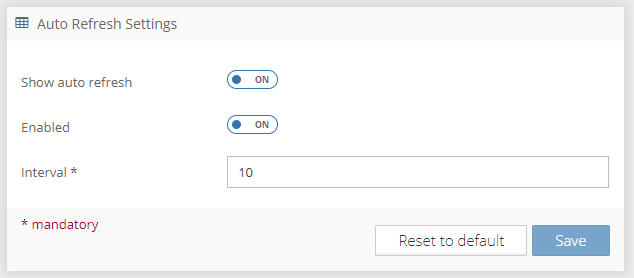
The auto-refresh panel can be used to enable the automatic data refresh in all visualizations of this project. Every data refresh checks the state of visualized nodes and relationships in the graph database, and when a property has changed, the user is notified, and changed elements are highlighted in the visualization.
When the “Show auto-refresh” switch is on, this button is added to the toolbox in visualizations:
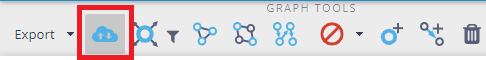
When “Enabled” is turned on, the added button is ON by default (when a visualization is opened or created), and when it’s turned off, the button is OFF by default.
Interval sets the number of seconds between every data refresh API call. 10 seconds is the minimal interval length.
2.5. Widget Management
Read more about visualization extensions called widgets on the Widgets page.
2.6. Project Icons
Read more about adding custom icons to a project on the Custom Icons page.