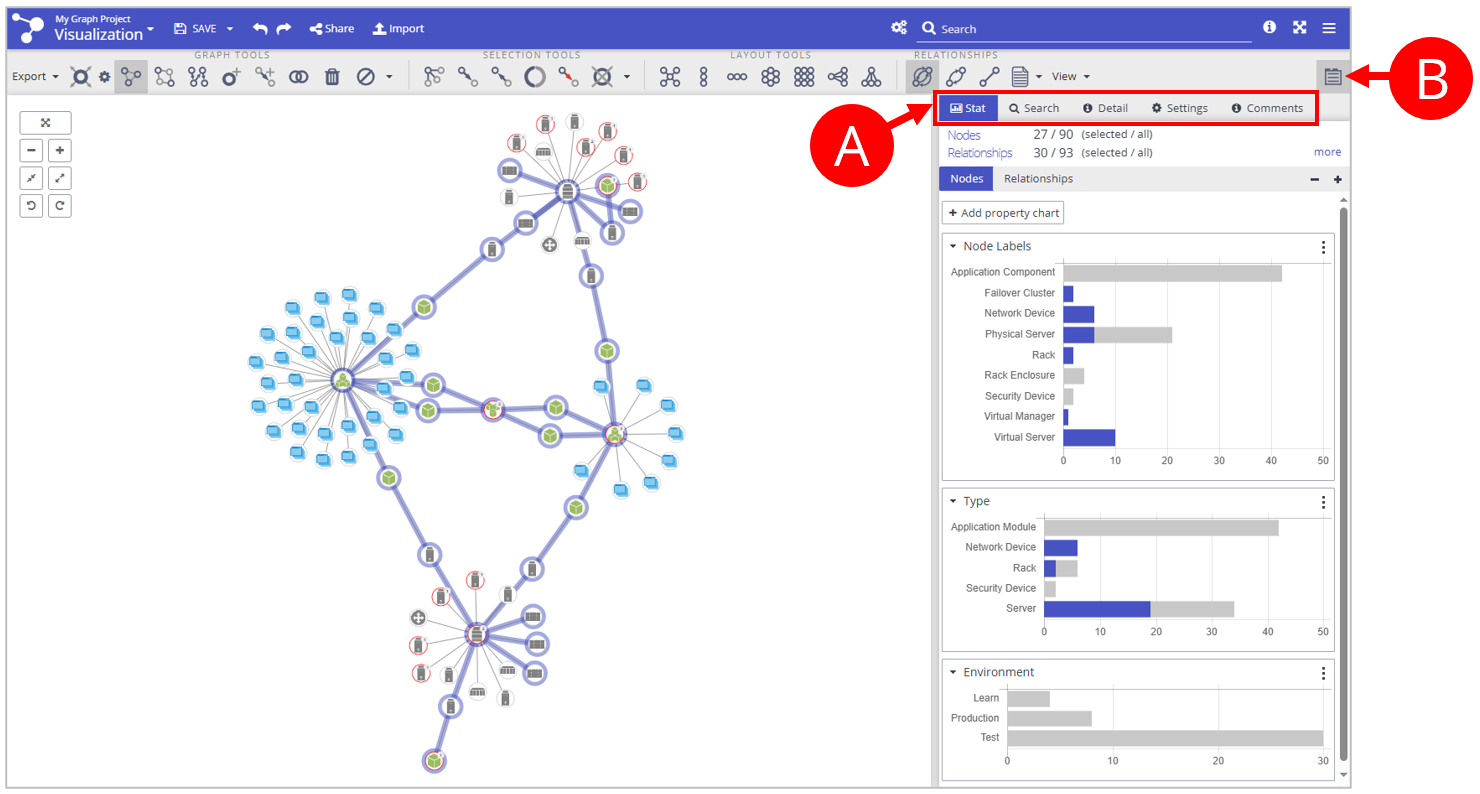
The Control panel is on the right side of the Visualization Workspace. The Control panel contains these tabs (A):
The Control panel can be turned on/off with a button in the top-right corner of the visualization (B).
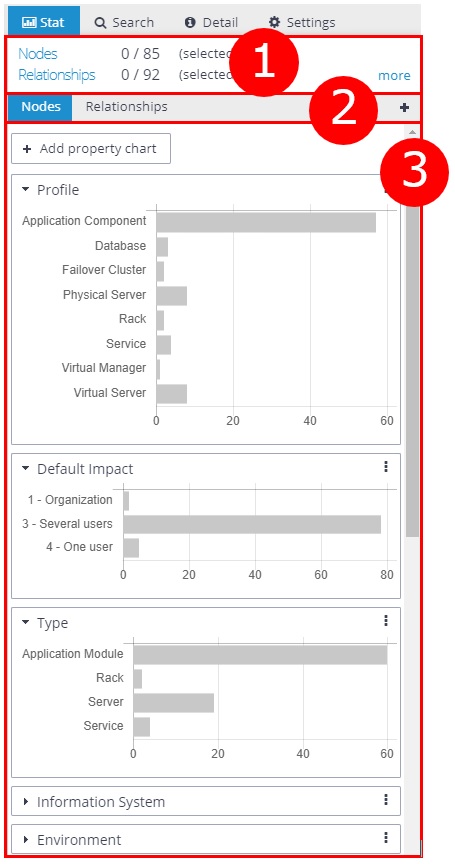
1. Statistics
Use this panel to filter elements in the visualization based on the values of their properties.
(1) Overview
Information about the number of elements (nodes and relationships) in the visualization and the number of selected elements.
(2) Elements switch
Choose between node or relationship data.
With icons plus and minus on the right, you can collapse or expand all histograms at once.
(3) Histograms
Histograms are charts showing the distribution of property values in the visualization. Clicking on the bars turns on/off the selection state of the appropriate elements in the graph.
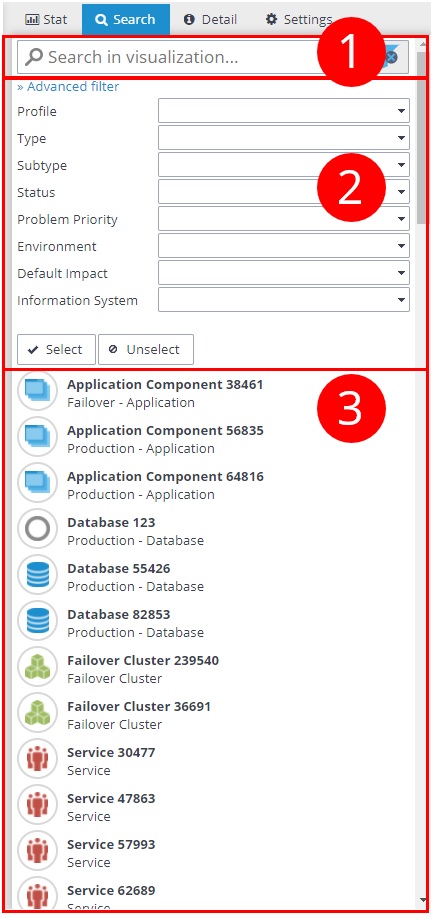
2. Search
Use this panel to search data in visualization (searched only in visualization and not in the database).
(1) Search by text
Enter text to search elements in the visualization.
You can clear all search and filter criteria by pressing the button to the left of the search text box at the top of the Control Panel.
(2) Filter
Select search criteria by selecting values in combo boxes. The filter can be hidden by pressing the "Advanced filter" button.
(3) Result
Result of the search (by text and by filter). If you click on an element in the result, this element is selected in the visualization. You can use the buttons "Select" and "Unselect" to select or unselect all found elements in the visualization.
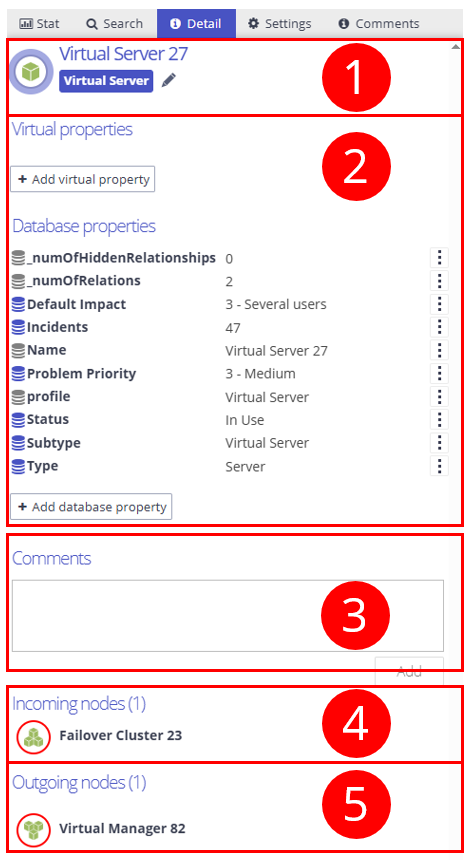
3. Detail
This panel contains all information about the selected element (node or relationship). If more elements are selected, this panel contains information about the first one.
(1) Identifier
Identifier of node and labels or word "relationship" and type if a relationship is selected.
(2) Attributes
Detailed listing of all properties of the selected element (or the first in the list of selected elements), divided into two groups:
Virtual properties with values computed for the selected node or relationship.
Database properties of the selected node or relationship. You can edit, hide, or delete every property based on your permissions.
(3) Comments
All comments associated with the selected node or relationship. Clicking on the trash icon deletes the comment.
(4) Incoming nodes
All incoming nodes of the selected node. You can choose a node in the visualization by clicking on a node icon in this list, or show details of a node by clicking on the name of a node.
(5) Outgoing nodes
All outgoing nodes of the selected node. You can choose a node in the visualization by clicking on a node icon in this list, or show details of a node by clicking on the name of a node.
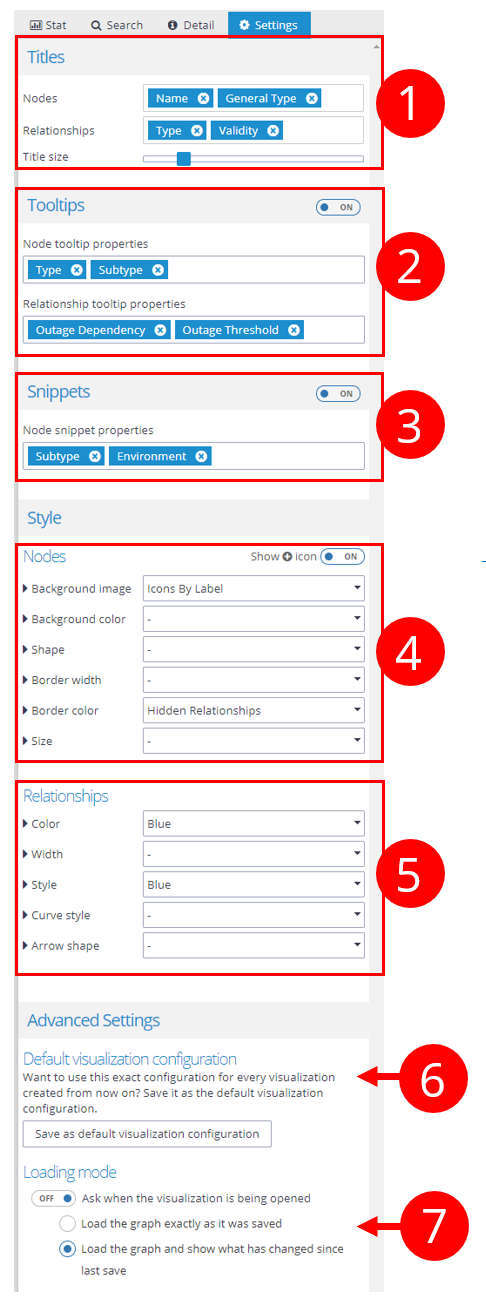
4. Settings
You can use this panel to set the style properties of the visualization based on the elements' data.
(1) Titles
Set which properties are used as a node's title and which as a relationship's title in the visualization canvas. Reorder the properties (drag & drop) to change the order of titles in the visualization. Set the size of the titles in the visualization with the slider.
(2) Tooltips
Turn on/off tooltips for the elements in the visualization. Set which properties are listed in tooltips when you hover over a node or relationship in the visualization. Reorder the properties (drag & drop) to change the order of properties in the tooltips.
(3) Snippets
Turn on/off the second line of node snippets used in the Search Tab and Detail tab. Set which properties are listed in the second row of node snippets.
(4) Node style mappers
Set nodes' icon, background color, shape, border color, border width, or size based on nodes' data. See Styling the visualization for further information.
(5) Relationship style mapper
Set relationships' color, width, style, curve, or arrow style based on relationships' data. See Styling the visualization for further information.
(6) Default visualization configuration
Every newly created visualization is using the so-called default configuration for titles, tooltips, styles, icons, etc. This default configuration can be overridden with the "Save as default visualization configuration" button. After overriding the default configuration, every visualization that will be created will use the same exact settings as are set in the current visualization at the moment of overriding.
(7) Loading mode
Configuration of the visualization loading mode. When visualization is opened, these options how the data is loaded can be chosen:
Snapshot - The saved graph is loaded and visualized exactly as it was saved.
Refresh - The graph is loaded and every node and relationship is checked against the graph database for any changes. If some changes are detected then the refreshed data is used and changed elements are highlighted.
Query - If the visualization was created using a query (cypher or Query Template) then there's also an option to automatically reload the query on visualization loading.
With the "Ask when the visualization is being opened" option turned on the user will be able to choose from the options during the visualization loading.
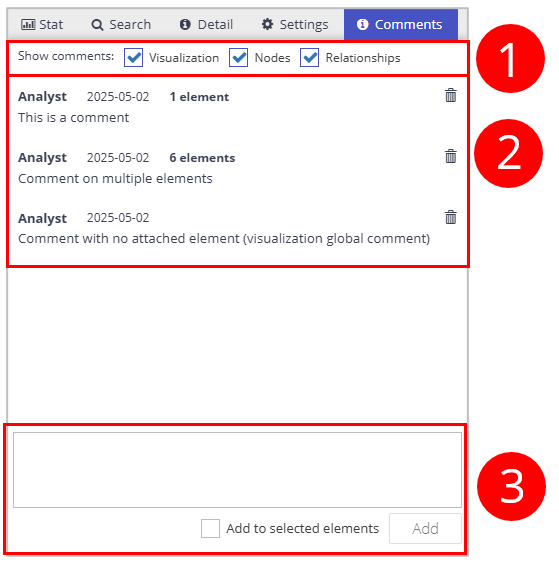
5. Comments
This tab lists all comments created in this visualization. Comments can be created as global visualization comments (without any attached element) or attached to one or more nodes or relationships. When a node has a comment attached to it a bubble is shown in the left top corner of the node with the number of comments that are attached to it:
The Comments tab consists of these parts:
Filter - checkboxes for hiding/unhide of comments based on where they are attached (to nodes, relationships, or without attached elements).
Comments - list of all comments that are not filtered out.
Clicking on the “N elements” label selects the attached elements in the visualization.
Clicking on the trash icon deletes the comment.
Input a new comment - type in your text and check the “Add to selected elements” if needed. Create comments using the “Add” button.
