Table of Contents
Graphlytic is used to analyze and visualize connected data (graph data). Graphlytic visualization is intended to be used as a canvas where users can place nodes from a graph database and interactively explore their relationships, create additional calculations, or modify data in a graph database. Data can also be manipulated automatically with data jobs running in the background (loading data from other sources, checking for patterns, and sending notifications, etc.).

1. Visualization Canvas and Tools
Visualization provides a set of easy-to-use tools for graph manipulation in order to highlight particular features of the graph. These features include intuitive data exploring (see clip below) and statistics, different automatic layouts, dynamic selections, shortest pathfinding, mapping data to the style properties like color or size, creating dynamic formulas in JavaScript to calculate new properties of the graph elements, and much more.
The visualization contains several components:
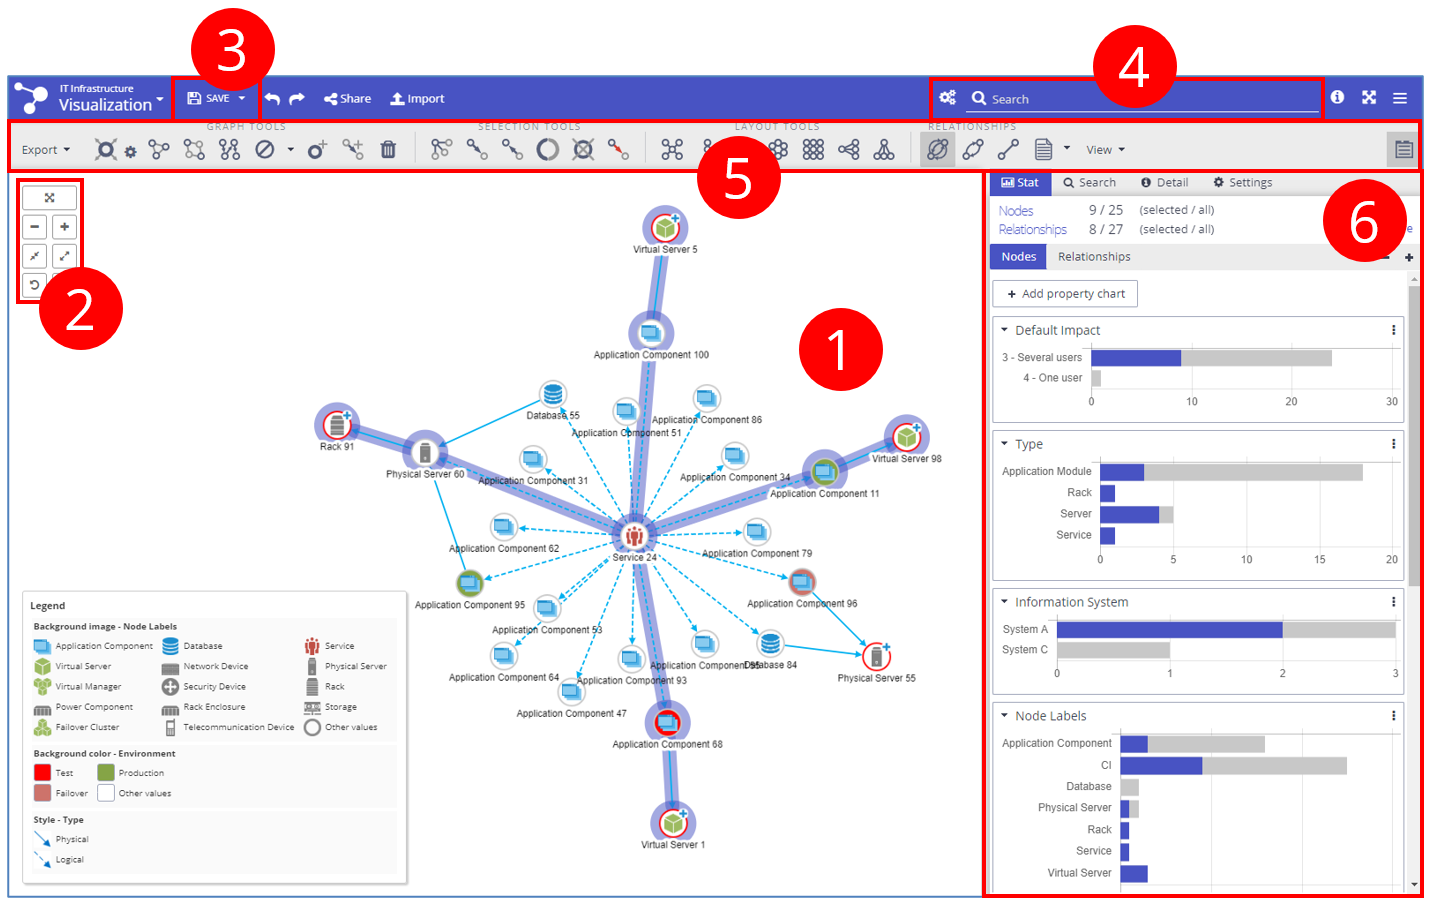
(1) Visualization Canvas
Contains elements from the database which are visualized as a graph. You can interactively manipulate these elements (for example move them to rearrange the graph).
Select element - Click on an element to select it.
Select more elements
Hold "SHIFT" and click on several elements.
Hold "SHIFT" and select (click+drag) a Workspace area containing one or more elements.
Press "CTRL(⌘)" + "A" to select all elements in the workspace.
Move element - Hold the left mouse button on a selected element and move the mouse to move the element.
Explore node - If a node has some neighbors that are currently not shown in the visualization, it is not entirely explored. This node is marked with a number in the right top corner. It’s the number of not visualized relationships of this node. Doubleclick explores this node, and all relationships with its neighbors are shown.
Move view - Click and hold the left mouse button on the workspace (away from any shown elements) and move the mouse to pan the whole view.
Zoom view - Use the mouse wheel to zoom in and zoom out. The zoom center is the current position of the mouse cursor.
(2) Zoom Panel
The zoom panel provides buttons for zooming or centering the graph in the workspace. For more information, please see the Zoom panel.
(3) Save Menu
Save your visualization or refresh data in visualization (compare node and relationship data to the current state in the graph database).
Menu contains:
Save: The current visualization is saved. The saved visualization can be reopened later (see Projects).
Save As: Use this menu item to save the visualization with a new name.
Reload Data: The visualization state is compared to the current database state. Data from the database is loaded and compared to data in the visualization. There are three possible situations:
data in the visualization is the same as data in the database. After pressing "Reload Data", the user is notified that nothing has changed.
some elements that are visible in the visualization were removed from the database. After pressing "Reload Data", elements that were removed from the database start flashing, and following this, these elements are removed from the visualization.
some attributes were changed in the database. After pressing "Reload Data", elements whose attributes have changed will be selected.
Reload Query: Query, which was used to create the visualization, is used to load a new result set from the database. All nodes and relationships in the visualization are removed and the query result set is visualized.
(4) Graph Search
Search with fulltext for nodes in the graph database and add them to your visualization with one click. Next to the search input are buttons for Fulltext Index settings and for file import (if the user has the right permissions).
For more information, please see Graph Search.
(5) Tools Panel
The tools panel consists of multiple button panels for graph manipulation, including moving elements, changing layout, selecting elements, and much more. For more information, please see the Tools panel.
(6) Control Panel
The Control panel has multiple tabs with special functionality. There are tabs for searching in visualized elements, showing all attributes of elements, configuring the style of visualization, or filtering elements based on simple statistics. For more information please see the Control panel.
1.1. Context menu
The context menu in visualization provides a convenient way how to access and run operations with the selected elements of the graph.
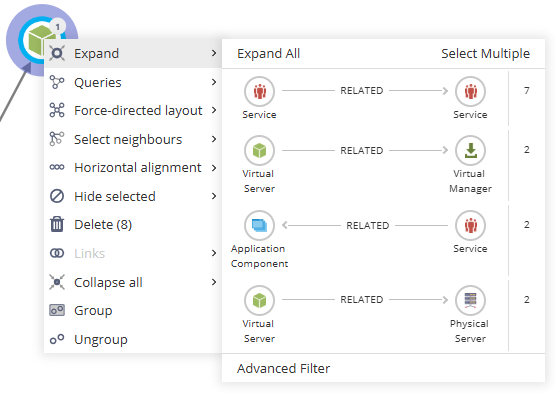
Expand - This menu allows to expand nodes (load node’s relationships from the graph DB). When opened, an overview of various relationship types is shown. Clicking on any relationship type will add them to the visualization. Multiple types can be chosen, or more advanced filtering options can be shown with the “Advanced Filter” option.
Queries - This menu allows you to run queries in the graph. Adding your own queries is possible by configuring a query template with at least one “NODE_FULLTEXT_SEARCH” dynamic parameter. Such queries will then be listed in this menu. See the Queries page for more information.
Layouts - All available layouts are available in this menu. Every layout works with the selected part of the graph or with the whole graph when no element is selected.
Selections - Selections are actions that select neighbors of already selected elements in the graph based on some specific logic. For example, select all neighbors and select neighbors connected in a specific direction. You can create your own selection logic with the Widgets (contact us for more info).
Alignments - Alignment options allow the alignment of nodes in the visualization or create an evenly distributed node layout of selected nodes.
Hide elements - Hide elements with the options from this menu. You can hide all selected, or all unselected, or otherwise specified sets of nodes.
Delete elements - Delete permanently all selected elements from the graph DB. This menu option is available only to users with permission to modify the graph data.
Links - List of all URL links stored in properties of the selected elements. See the Data Schema for more info about the “url” property data type.
Collapse nodes - Options for node collapsing (hiding of its relationships). The “Collapse leafs” option hides relationships with a node on the other side that has no other relationships visualized.
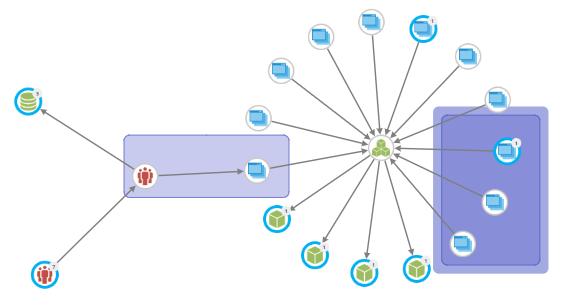
Group - Creates a group rectangle (called Group) containing selected nodes (see image below).
When a group and another node are grouped, the other node is added to the existing node.
Ungroup - Discards a group rectangle (called Group), and nodes from the group remain in the visualization.
When nodes inside a group are selected, the “Ungroup” action removes these nodes from the group.
Create relationships - when at least two nodes are selected, this option allows the creation of new relationships between the first node in selection and others. The first node in selection is the node that was selected as first when the current set of selected nodes was created.
1.2. Keyboard and mouse shortcuts
DEL : Hide selected nodes and relationships
CTRL(⌘) + DEL : Hide not selected nodes and relationships
CTRL(⌘) + SHIFT + DEL : Hide orphaned nodes (nodes with no relationships)
CTRL(⌘) + A : select all elements in the visualization
CTRL(⌘) + F : open the search tab in visualization and set focus on the search field so you can start typing the search string right away
CTRL(⌘) + Q : open the top search panel
CTRL(⌘) + S : save visualization
CTRL(⌘) + Z : undo the last operation (adding or removing of graph elements)
CTRL(⌘) + Y : redo the last undone operation (adding or removing of graph elements)
CTRL(⌘) + E : expand selected nodes
CTRL(⌘) + R : find all relationships between selected and unselected parts of the graph
CTRL(⌘) + SHIFT + R : find mutually related nodes for the selected part of the graph
CTRL(⌘) + W : find the shortest path between selected nodes
CTRL(⌘) + B : select neighbors of selected nodes
CTRL(⌘) + < : select incoming nodes of selected nodes
CTRL(⌘) + > : Select outgoing of selected nodes
CTRL(⌘) + I : invert selection
ESC : Unselect all nodes and relationships
CTRL(⌘) + L : layout the selected part of the graph using the force-directed layout
CTRL(⌘) + M : create a new node
CTRL(⌘) + SHIFT + M : toggle adding of new relationships
CTRL(⌘) + X : delete selected nodes and relationships
CTRL(⌘) + UP_ARROW : horizontal ALIGNMENT of selected nodes
CTRL(⌘) + LEFT_ARROW : vertical ALIGNMENT of selected nodes
CTRL(⌘) + RIGHT_ARROW : equal horizontal SPACING between selected nodes
CTRL(⌘) + DOWN_ARROW : equal vertical SPACING between selected nodes
CTRL(⌘) + MOUSE WHEEL or SHIFT+ MOUSE WHEEL : stretch out or compress the selected part of the graph (expand or reduce the spacing between nodes)
ARROWS : move the selected part of the graph in the desired direction
Hold the right mouse button and move the mouse : rotate the selected part of the graph (or the whole graph if nothing is selected)
2. Start a new visualization
Save all changes in the current visualization (if opened).
Open the Projects menu - click on the app logo in the header (top left corner) and select "New" (in case of multiple projects, find the desired project and click the "New" button next to the name of the project).
3. Add elements to the currently opened visualization
When you have a visualization open, you can add nodes to the visualization with the Graph Search bar in the header of the application.
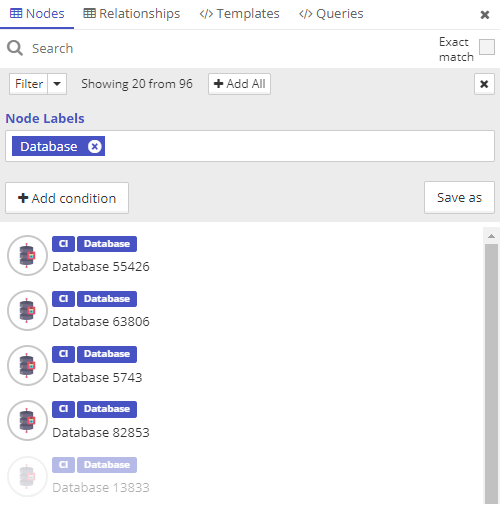
Adding elements from the Queries page (advanced query and filtering options are available on the Queries page):
Open the visualization where you want to add graph elements.
Go to the Queries page - click on the Menu icon in the main menu (top right corner of the header) and select "Queries" (available also in the Search menu under “Manage Queries”).
Note: save the visualization (if asked) so you don't need to worry about losing any work.
Find a query and run it with the "Run Query" button.
Press the "Add to visualization" button to add the result of the query to the last opened visualization (the name of the visualization is next to the logo in the header).
Visualization is opened, and all selected elements are added to the existing visualization. Added elements are highlighted.