Table of Contents
The Tools panel is the top part of the Visualization Workspace. It contains buttons that are logically separated into several parts:
In order to keep the Tools Panel responsive and to give some flexibility over the panel appearance, we have added drop-down menu options for:
Paths (part of the Graph Tools menu)
Selection Tools
Layout Tools
Relationship models
The fully expanded Tools Panel look's like the one in the screenshot above. The menus are automatically collapsed on devices with lower screen width into separate drop-down menus and with all of them collapsed it looks like this:
1. Menu "Export"
1.1. Export nodes (CSV)
Export nodes from the visualization into a CSV file. See Export.
1.2. Export relationships (CSV)
Export relationships from the visualization into a CSV file. See Export.
1.3. Image export (PNG)
Export an image of the visualization in PiNG format. See Export.
2. Graph Tools
Next to the "Visualization" menu are several buttons for graph operations that adds or removes elements from visualization:
From left to right:
2.1. Explore selected nodes
If a node has some neighbors which are not visible in the visualization, such a node is not completely explored. It will have a "+" symbol overlayed, and you can explore it. Select one or more of such nodes and press "Explore selected elements". If selected nodes have some hidden neighbors, they will be displayed.
2.2. Find all relationships
When switched to ON, all relationships between selected nodes and not selected nodes are added.
When turned ON then relationships between nodes added from actions like graph expanding and the rest of the visualization are automatically added.
2.3. Find mutually related nodes
Add all nodes and relationships connecting selected nodes.
2.4. Find the shortest path
This feature can be used to find the shortest paths between two nodes in a graph.
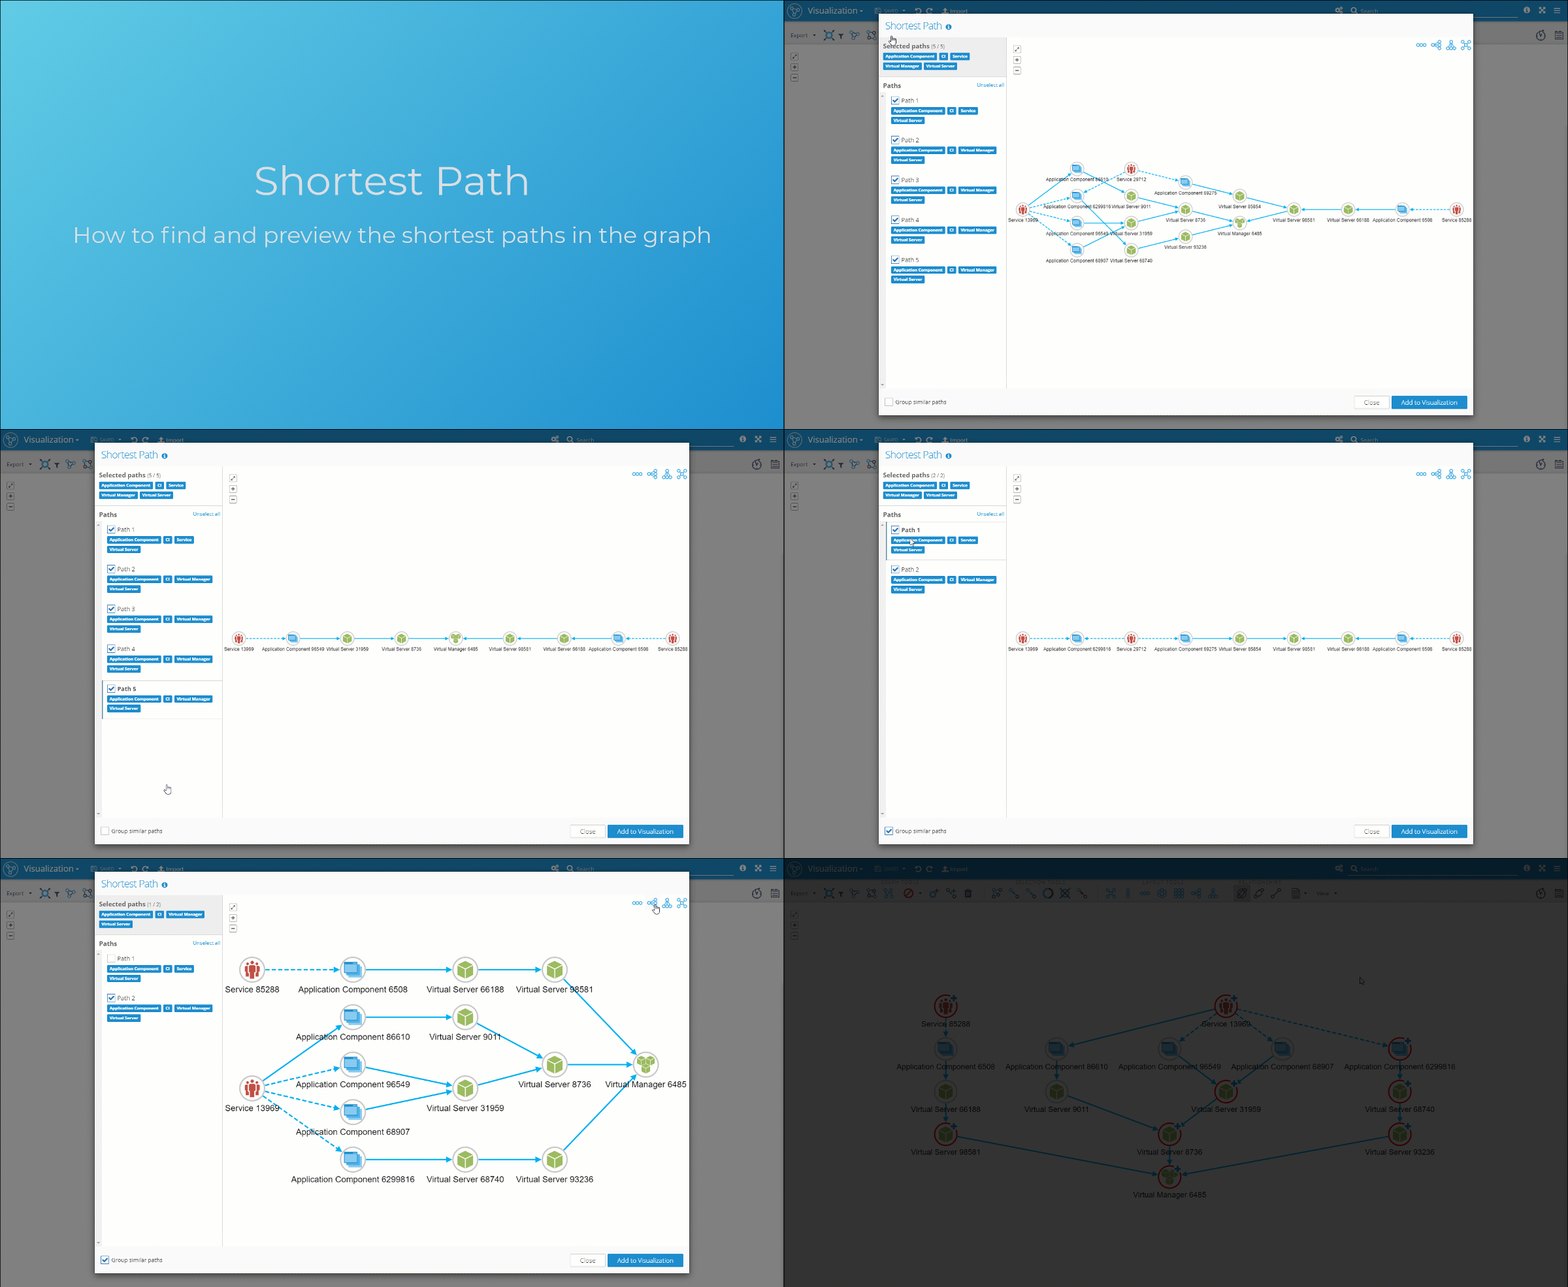
Select two nodes and press the "Find the shortest path" button. All shortest paths are calculated and the user can choose which paths to add to the visualization. The paths are calculated using all data in the graph database and not visualized parts are automatically added to the visualization.
The Shortest Path Preview window offers:
Filter - configure filters (node and relationship conditions) and basic configuration like the maximal length of paths or maximal number of returned paths (for performance limits)
Path selection - separate paths can be selected or unselected. Selected paths are combined in the "Selected paths" tab - this is the resulting subgraph, that will be added to the visualization.
Path grouping - usually a lot of the paths are similar in the sense that they have the same types of entities along the path. These paths can be grouped together with the "Group similar paths" checkbox to easily select/unselect whole groups.
Layouts - different layouts are available to further refine the preview.
2.5. Hide selected elements
Select the nodes or relationships which you want to hide in the visualization and press "Hide selected elements". Elements are removed from the visualization but not from the database.
Hide menu options:
Hide not selected - every not selected element will be removed from the visualization.
Hide orphaned nodes - every node without any relationship will be removed from the visualization.
2.6. Create a new node
Note: button is visible only if the user has permission for editing data in the database.
Click this button if you want to create a new node in the database. Properties of the node can be edited in the Control panel.
2.7. Create a new relationship
Note: button is visible only if the user has permission for editing data in the database.
Turn on relationships creation mode with this switch. When the mode is turned on you can see a small red dot when hovering over a node. This is a handle where you can start the new relationships (source node) and drag it to another node (target node). Properties of the relationship can be edited in the Control panel.
2.8. Delete selected from the database
Note: button is visible only if the user has permission for editing data in the database.
Select elements (nodes and relationships) in the visualization and click this button to permanently removing them from the database. You have to confirm this action in a modal window to prevent unwanted deletion.
3. Selection Tools
Buttons for selection of elements:
3.1. Select neighbors of selected nodes
Select all neighbors of all selected nodes and select all relationships between these nodes.
3.2. Select outgoing of selected nodes
The outgoing node is the node at the end of a relationship (the relationship has an arrow at this end). This selects relationships between these nodes also.
3.3. Select incoming of selected nodes
An incoming node is the node at the start of a relationship (the relation as shown in a visualization doesn't have an arrow at this end). This selects the relationship between these nodes also.
3.4. Invert selection of nodes
Invert selection in a visualization. This selects all nodes which were not selected and unselect all previously selected nodes and selects all relationships between previously not selected nodes.
3.5. Unselect nodes and relationships
Unselect all selected elements in the visualization.
4. Layout Tools
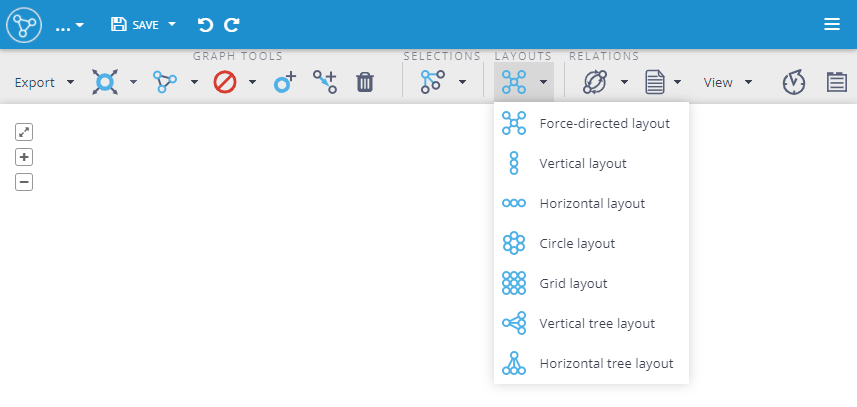
Buttons for running different types of layout algorithms can be found in the Layout Tools menu:
Other layout options, like aligning, stretching, or even spreading of selected nodes, are available as keyboard shortcuts. Please see Visualization for more information.
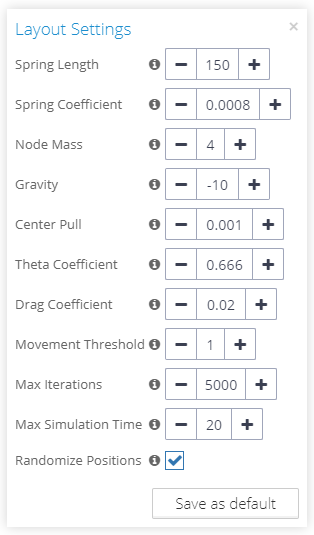
Clicking on the Layout Tools menu title will open a modal window allowing you to configure the layouts.
Only user with the Project Settings management permission has the “Save as default” button available to save the current configuration as the Project’s default values (used in every newly created visualization as the default).
4.1. Vertical layout
Selected nodes will be laid out vertically. The first node is not moved, all nodes have the same spaces between them.
4.2. Horizontal layout
Selected nodes will be laid out horizontally. The first node is not moved, all nodes have the same spaces between them.
4.3. Circle layout
Selected nodes will be laid out in a circle. The first node is not moved and stays in the center of the circle. Nodes are sorted by the Node Title property values (set in the Settings tab).
4.4. Grid layout
Selected nodes will be laid out in a grid. Every second node in the grid's lines is offset by 25% to minimize label overlapping.
4.5. Vertical tree layout
Selected nodes will be laid out in a tree, vertically (tree expands down from the top).
4.6. Horizontal tree layout
Selected nodes will be laid out in a tree, horizontally (tree expands from left to right).
4.7. Force-directed layout
Selected nodes will be laid out by the gravity algorithm. The result of this algorithm should be different every time. This algorithm works iteratively and every change between every iteration is animated by moving the nodes and relationships. This layout stops after a certain period of time because in large graphs this algorithm could take a very long time to find the best result.
5. Map
Button for turning on the geographical map layer under the graph:
Map layer is an optional feature that has to be enabled by the administrator of the system in the global Visualization Settings.
6. Virtual Relationship Models
Buttons for the virtual merging of parallel relationships:
Relationships are first-class citizens in graphs and a great source of knowledge but graph models with many parallel relationships can become very hard to visually analyze. For such use cases, Graphlytic supports virtual merging of parallel relationships into one relationship which then represents an array of relationships. There are three models of relationships that can be used:
Show all relationships - in this case, nothing is merged and all relationships are visualized exactly as they are stored in the database.
Merge parallel relationships with the same direction - this model merges parallel relationships with the same direction. When using this model you can visually distinguish if two nodes are connected and if they have connections in both directions or if their relationship is one-directional.
Merge all parallel relationships - this model merges all relationships between two nodes and does not distinguish directions. It's used when you need to see if there is or is not a connection between nodes. This model is easier to render and therefore is recommended to use it when you want to visualize large graphs.
All models support Virtual Properties which can be used also for creating style rules to visualize patterns in the data.
7. Menu "Reports & Simulations"
Menu for running custom widgets, typically reports and graph simulations:
Widgets are small UI components that enhance the visualization functionality in customer-specific use cases. Typical widgets that can be run from this menu are Report and Simulation widgets, which calculate some values or download data from other sources based on the data in the graph and present the results in the form of a table in a modal window.
8. Menu "View"
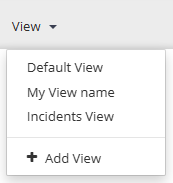
Menu for selecting predefined Views for quick visualization style change:
The View Menu contains a list of predefined styling rules for visualization called Style views. If you select one of the predefined styles, the visualization is styled accordingly.
After a View is applied, the style can be manually adjusted in the Style tab of the Control panel.
Views can managed by the Project administrator (user with the Project Settings permission) directly in the visualization or on the Project Settings page.
9. Timeline switch
Switch for turning on and off the Timeline:
Go to the Timeline page for more information.
10. Control Panel switch
Switch for turning on and off the Control Panel:


