Table of Contents
Graphlytic's Timeline is a filter for filtering out nodes and relationships based on date and time data stored in their properties.
1. Controls
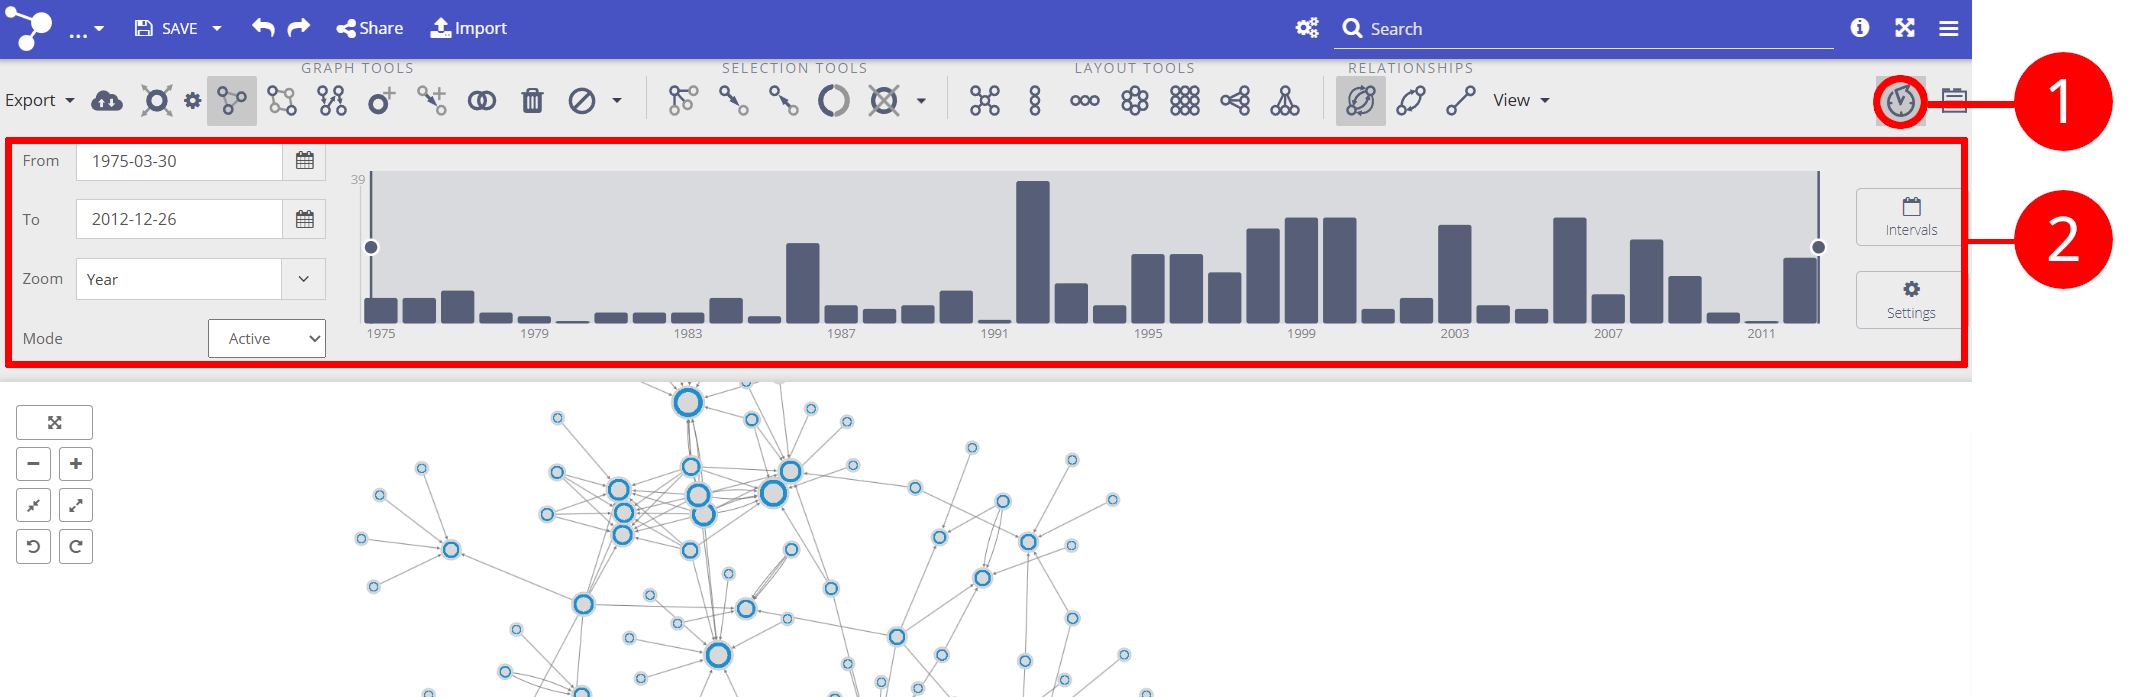
1.1. Timeline toggle button (1)
The timeline can be switched on and off with the timeline switch in the Tools panel :  The switch is available only when timeline is configured for the current project (see project's Visualization Settings); otherwise the toggle is hidden.
1.2. Timeline widget (2)
When turned on, the widget is docked at the top of the visualization, above the graph canvas, and contains the following controls (from left to right):

1.2.1. Date From / Date To
Two date pickers showing the current low/high boundary of the selected interval. Picking a date in either field moves the corresponding handle on the histogram and re-filters the graph. The picker shows time fields only when Show time is enabled in the configuration.
1.2.2. Zoom
Histogram bucket granularity: year, month, week, day (and hour if Show time is enabled). Zoom affects only the histogram resolution — it does not change the selected interval.
A list of available ranges can be configured on the global level in the Visualization Settings.
1.2.3. Bar mode
Controls what each histogram bar counts:
Active — number of elements whose lifespan overlaps the bucket. Useful for "how many things existed at this point in time".
Changes — number of elements that start or end inside the bucket. Useful for spotting bursts of activity (creates / deletes).
1.2.4. Histogram & handles
The histogram shows the distribution of elements across the visible time axis. Two handles (low / high) delimit the selected interval; bars inside the interval are highlighted. You can:
Drag a handle to move one boundary.
Drag the interval overlay (anywhere between the handles) to slide the whole interval without changing its width.
Pick from preset ranges (see below) for fixed-width shortcuts.
1.2.5. Timeline ranges
The Intervals menu (calendar icon, top-right of the widget) is a list of preset interval lengths — e.g. Last 1 year, Last 30 days, Yesterday. Picking a preset sets the high boundary to the maximum available date and the low boundary to high − range.
A range entry is a pair of:
Title — label shown in the dropdown
Range — length of the interval in milliseconds (e.g. 31536000000 = 1 year, 86400000 = 1 day)
Ranges are configured per visualization in the Settings dialog (see Configuration).
1.2.6. Settings
Opens the Timeline Settings dialog where Start/End date properties, date format, Show time, default On/Off state and Ranges are configured.
2. Data model
The timeline filter is based on the premise that every element (node or relationship) can be created once and deleted once, so each element can have two properties representing the start date and end date of its lifespan. These two properties — together with the date format — are mapped in the Timeline Settings dialog.
If your data model has only one datetime point (e.g. events, log entries, workflow steps), set Start date property and End date property to the same property. The element is then treated as a point event.
Supported date formats:
epochTimeNumber — raw number (epoch milliseconds, e.g. 933631424292)
epochTimeString — same value stored as a string (default, also accepts numbers)
ISO-like patterns — YYYY-MM-DD, YYYY-MM-DD hh:mm:ss, YYYY.MM.DD hh:mm:ss.ms, YYYYMMDD, YY-MM-DD
Day-first patterns — DD.MM.YYYY, DD.MM.YYYY hh:mm:ss, D.M.YY, DD/MM/YYYY
Month-first patterns — MM/DD/YYYY, M/D/YY
Properties used by the timeline must be present in the Data Schema for the relevant node/relationship types so they show up in the property dropdowns.
3. Filtering
Every time the timeline interval is changed, the visualization snapshot is recalculated and only time-relevant elements remain visible. Relevancy is computed from the start date and end date of each element:
An element is visible if its lifespan overlaps the selected interval — i.e. start ≤ interval_high and end ≥ interval_low.
A relationship that survives this rule but whose endpoint node does not is also filtered out (orphan relationships are never shown).
The diagram below illustrates the rule for 3 nodes and 1 relationship across different intervals:
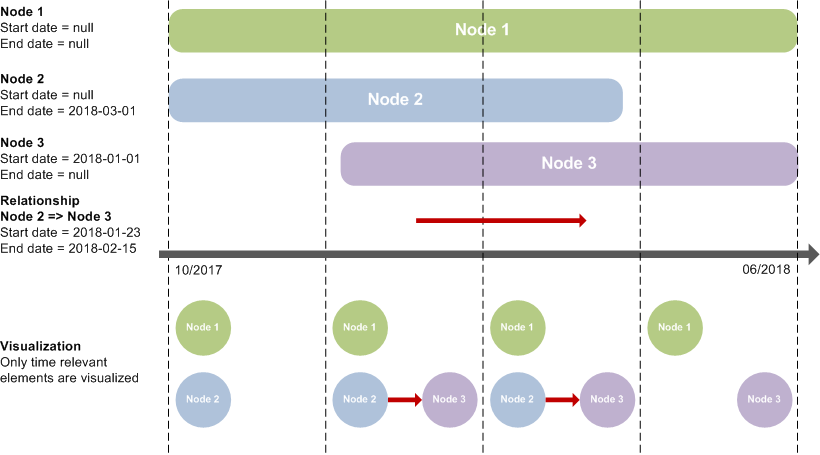
Above the time axis: time relevancy of graph elements visualized as bars with start and end according to the time axis.
Below the time axis: elements that will be visualized if the time interval is set according to the vertical dashed lines.
4. Timeline settings
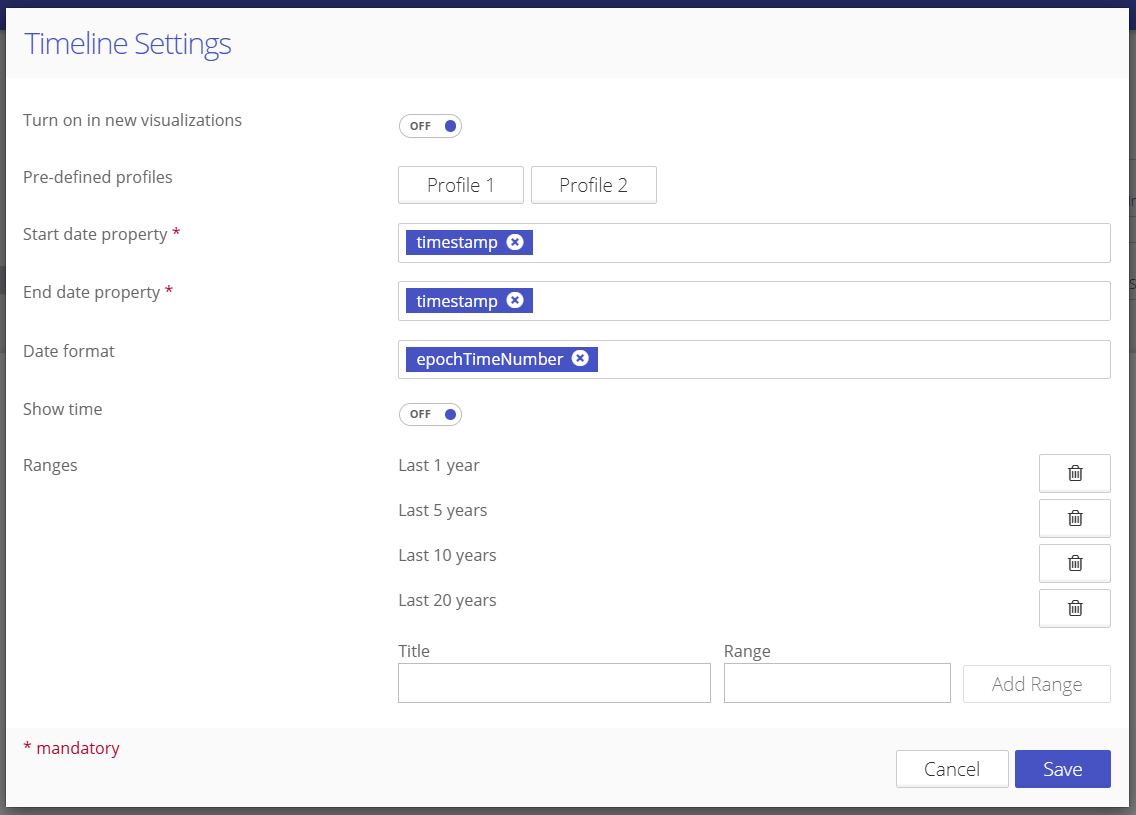
Field | Description |
|---|---|
Turn on in new visualizations | Whether the timeline starts in the on state when the visualization is opened. |
Pre-defined profiles | Timeline profiles may be used to conveniently set Start and End date properties. Field is available only when a timeline profile is configured in Visualization Settings |
Start date property | Name of the node / relationship property holding the start date. Required. |
End date property | Name of the property holding the end date. Set it equal to Start date property for point events. Required. |
Date format | Format used to parse the raw property values. Pick one of the predefined formats (see Data model). |
Show time | When enabled, date pickers and histogram include hours/minutes; hour zoom level becomes available. |
Ranges | List of preset intervals (Title + Range in ms) shown in the Intervals dropdown of the widget. Add as many as you need; delete via the trash icon. |