Graphlytic 3.2 brings the Query Templates, redesign of the Search & Manage Data page, Auto-refresh of data in the visualization, and improved documentation. We've also added a dedicated page in the documentation about all the integration options of Graphlytic. If you are interested in using Graphlytic as a part of a broader solution please visit the Integrations page.
Note: full release notes can be found here: Release Notes
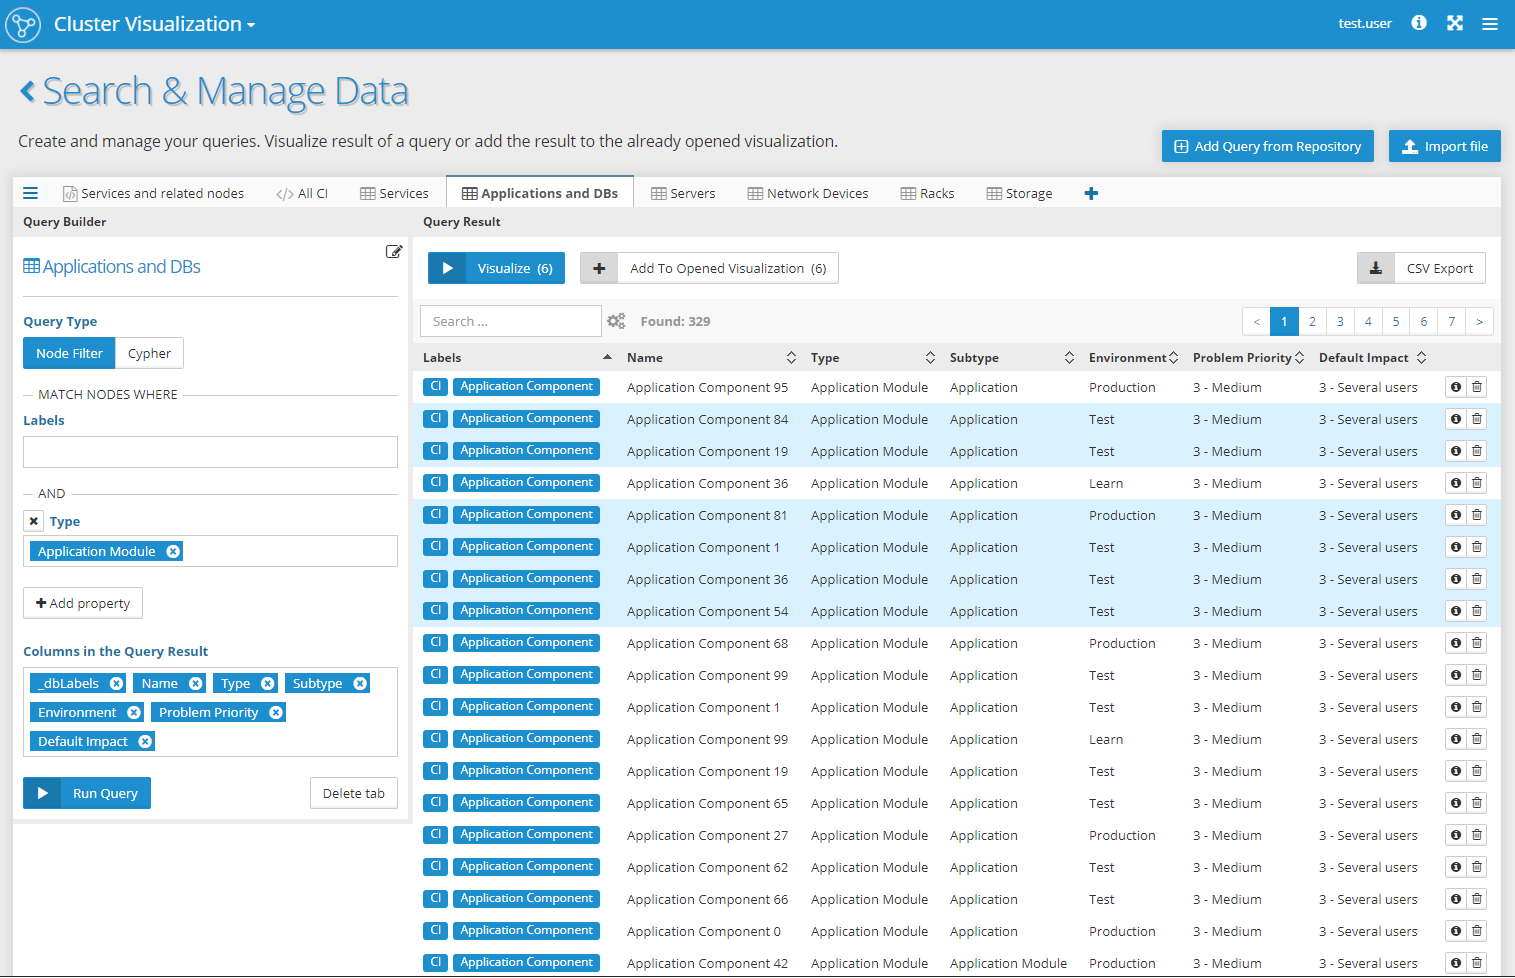
We have added quite a lot of features to this page in the previous releases and the UI became a bit hard to follow for all the different features. With adding of the Query Templates (see chapter below for details) it became apparent that the main flow of the page has to be changed. That's why we have to get rid of the top toolbox panel. Buttons and menus from this panel were moved into the Query Result panel and are displayed only when they make sense for the task at hand. This brings a less cluttered UI with more functionality.
List of main changes:
Example of the new Node Filter query builder and result panels:

Let's face it - not everybody likes writing Cypher queries. Not everybody knows how to write them but they are so helpful in everyday tasks involving graphs that everybody is using them, in one way or another. To bring the power of Cypher into the hands of all users we are introducing Query Templates - custom Cypher queries presented to the user in a human-readable form with dynamic parameters (with suggestions) that the user can use to change and use the query without any Cypher knowledge.
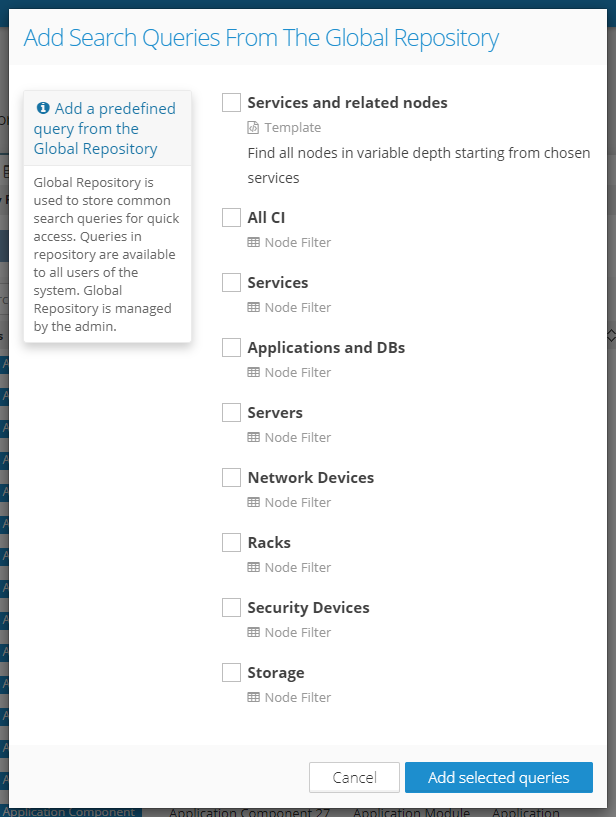
The implementation in this release is only the beginning of a whole new feature set that will be built on this foundation. What is included is the possibility to define a Query Template (yes, it's just another JSON configuration) and then any user in the system can add this Template from the Query Repository to their personal queries on the Search & Manage Data page.
As an example let's use the IT infrastructure demo on our website and this use case: IT support (non-cypher friendly people) needs to find certain Service nodes and their underlying infrastructure multiple times a day. This can be achieved with the already present features:
With larger infrastructures, this can take some time and it can be prone to human error, especially with the filtering out part of the task. The obvious solution is to write a Cypher query which will do this job in just one step but then there is the question of reusing such a query. And that's where the Query Template comes in.
The query in question can look like this (for sure there are other options how to write it, please feel free to leave a comment below, if there is a much better way to do it.):
MATCH p=(a:Service)-[r*1..3]->(b) WHERE a.name IN ["Service 1","Service 2"] WITH nodes(p) AS nodes, relationships(p) as rels UNWIND nodes AS node UNWIND rels AS rel RETURN node, rel
We can simply wrap this query and call it a Template but that will miss the biggest feature - dynamic parameters. In this example we know, that what is changing from task to task are the starting points (the list of Service nodes) and the depth to which we need to explore the infrastructure. So let's put two dynamic parameters "depth" and "nodes" into the query:
MATCH p=(a:Service)-[r*1..$depth]->(b) WHERE a.name IN $names WITH nodes(p) AS nodes, relationships(p) as rels UNWIND nodes AS node UNWIND rels AS rel RETURN node, rel
And now let's add some configuration and description to it. The configuration is mainly about the definition of the input field that will be used (free text, drop-down, ...) and about suggestions that can be loaded directly from the graph.
{
    "title":"Services and related nodes",
    "description":"Find all nodes in variable depth starting from chosen services",
    "template":{
        "textTemplate" : "Return all nodes related to services $names with max depth $depth",
        "cypherTemplate" : "MATCH p=(a:Service)-[r*1..$depth]->(b) WHERE a.name IN $names WITH nodes(p) AS nodes, relationships(p) as rels UNWIND nodes AS node UNWIND rels AS rel RETURN node, rel",
        "parameters" : [
            {
                "parameter" : "depth",
                "type" : "NUMBER",
                "config" : {
                    "values" : ["1", "2", "3", "4"],
                    "strict" : true,
                    "placeholder" : "select depth of the search"
                }
            },
            {
                "parameter" : "names",
                "type" : "NODE_PROPERTY_VALUES",
                "config" : {
                    "multiple" : true,
                    "property" : "name",
                    "labels" : ["Service"],
                    "placeholder" : "select services"
                }
            }
        ]
    }
}
This Query Template definition can be stored in the SEARCH_TABS global configuration, which will allow all users to add this Template on the Search & Manage Data page to their personal queries.

Then it's very easy to reuse the Template in any task involving a set of Service nodes and a depth of searched infrastructure dependencies. Just select the nodes and the depth, run the query and visualize the result.
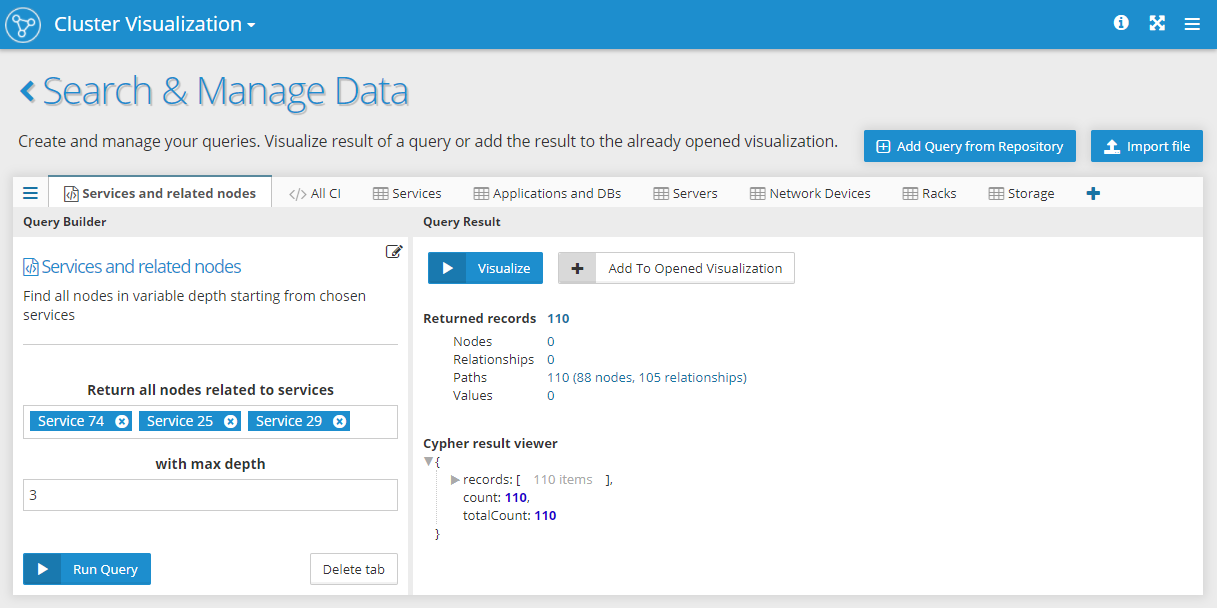
This is how the Query Builder and Query Result panel looks like for this Template:

If you want to try this template log into our IT infrastructure demo and try it out. Please let us know how you like it or if you find something we can add to make the use of Query Templates even better.
We've improved several existing features in the visualization like the Lasso selection, panning of the graph during node dragging, default configuration and design of the graph elements. One notable feature that I'd like to mention here is the Auto-refresh feature which can be used to periodically look for any changes in data for the visualized elements. This can be helpful in use cases where the data in the graph database is changed rapidly and the graph operator needs to turn the visualization into a live (or near-live) dashboard. For this purpose, we have added new VISUALIZATION configuration "autoRefresh".
"autoRefresh":{
    "enabled" : false,
    "interval" : 60,
    "onRefresh" : "console.log(changes.nodes.length);"
}
When the Auto-refresh is configured then an icon for turning it on and off is added to the toolbox in the visualization:

You can find the description of the configuration options in the documentation so here I'd like just to point out some basic things:
Most of the features presented in this article can be found in our demos, please take a look and let us know what do you think in the comments below.