Versatile | Enterprise-ready | Affordable

Graphlytic provides teams with all the tools needed to find the smallest needles in the largest (data) haystacks.

Most common scenario when you want to find answers in your graph data.


Native graph database with Cypher language, security, and data integrity for mission-critical intelligent applications.
Azure Cosmos DB is a fully managed NoSQL and relational database for modern app development.
Memgraph is an open source graph database built for teams who expect highly performant, advanced analytical insights.
With Jobs it's easy to write and schedule your own scripts for importing data, searching patterns and sending emails.
Data analysis doesn't have to be a lonely job. Collaborate with others and share your findings or export images and data.
Contact us if you are interested in using Graphlytic in specific business cases. We are happy to help you with the setup.


Graphlytic is helping in many industries. See our most common use cases below.
The human eye captures fraud schemes within graph visualization blazingly fast! Unveil sophisticated fraud and criminal patterns much easier. Cut the manual analyst research time. Dive deeper into your data. Achieve significant savings.
Learn more
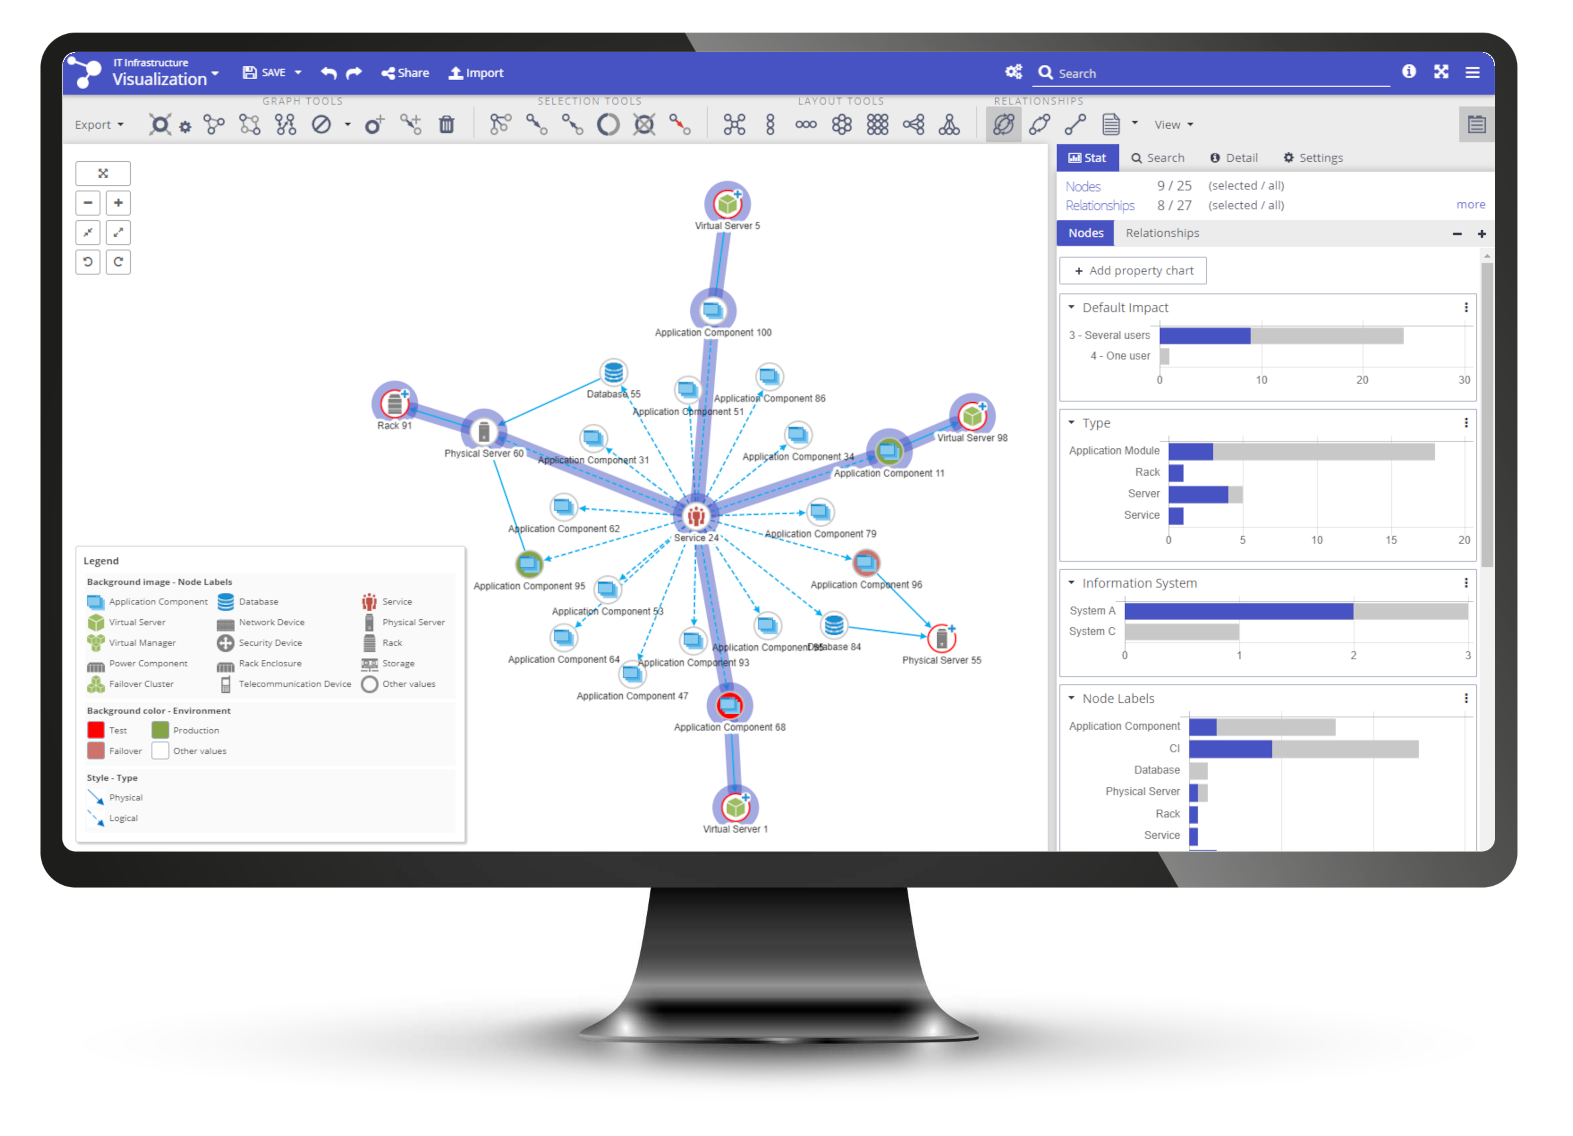
Visualize and catalogue assets in your complex network or data center, depicting critical dependencies. Manage your IT operations with higher confidence and find bottlenecks before they generate any incidents.
Learn more
Find out correlations between communication and business results. Discover informal communication patterns within your teams in one picture. Leverage the power of graph visualization to better manage your organization.
Learn more
Gain control over the code by establishing code clarity and elimination of duplications in code using graph visualization model. Get strong support for code documentation and quick onboarding for new team members.
Learn more
Demtec, s.r.o.
Hraničná 18
821 05 Bratislava
Slovakia
ID: 47807890
VAT ID: SK2024104434
EMAIL: info@graphlytic.com
TEL: +421 944 289 809


