After months of dedication, countless late nights, and relentless iteration, I’m incredibly proud to announce the official launch of the new version of the Graphlytic platform. This release has been a long time coming - and for good reason. Packed with powerful new features and performance enhancements, this version improves every aspect of Graphlytic. Today, I couldn’t be more excited to share what we’ve built with you.
This release is packed with so many new features and improvements that it would be impossible to cover them all in a single blog post. So we’ll focus on the highlights here. The full list of changes can be found in the Release Notes.
Large Language Models (LLMs) have been an integral part of Graphlytic since version 5.0, helping our users harness AI for advanced data processing. With the release of version 5.1, we’re taking a major step forward by integrating Graphlytic with our new Cloud AI platform. This upgrade is designed to deliver seamless access to AI-powered features—no setup or infrastructure required on your end. It’s all part of our long-term vision: making powerful, intelligent graph analytics accessible and affordable for everyone.
We are excited to announce that Graphlytic now officially supports Apache AGE as a new graph database connection type.
Apache AGE is a smart extension built on PostgreSQL that brings Cypher support for graph queries. This makes it the perfect choice if PostgreSQL is your primary database technology and you want to seamlessly add powerful graph capabilities, such as relationship searching and graph-based data modeling, without switching platforms.
A lot of new features and improvements in the visualization have been made. Before we get deeper into the major ones, I'd like to point out a few nice improvements that I'm very happy about:
Now let's get to the major visualization features.
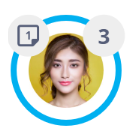
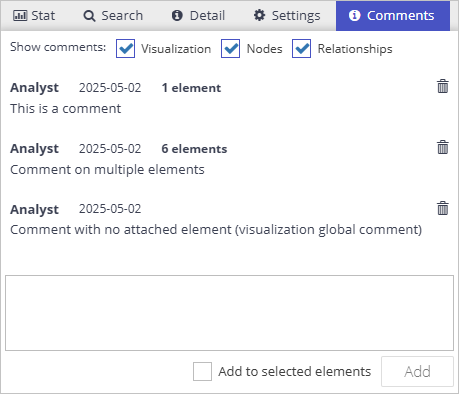
The right control panel now has a new tab for graph commenting. Comments can be attached to the visualization as a whole or to groups of nodes and relationships and are saved with the visualization, not affecting the graph database data. This provides an easy and effective way to store notes about elements or patterns and share them with others in the team.
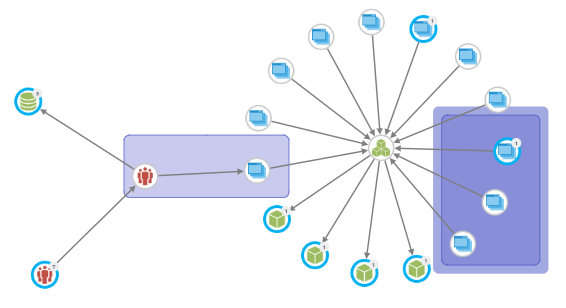
Node groups are a great way to highlight notable groups of nodes when comments alone are not enough. Simply select a few nodes and use the Group/Ungroup options from the context menu. Hint: Nodes can be flexibly added to or removed from existing groups, making it very easy to rearrange things as the discussion in the comments tab progresses.
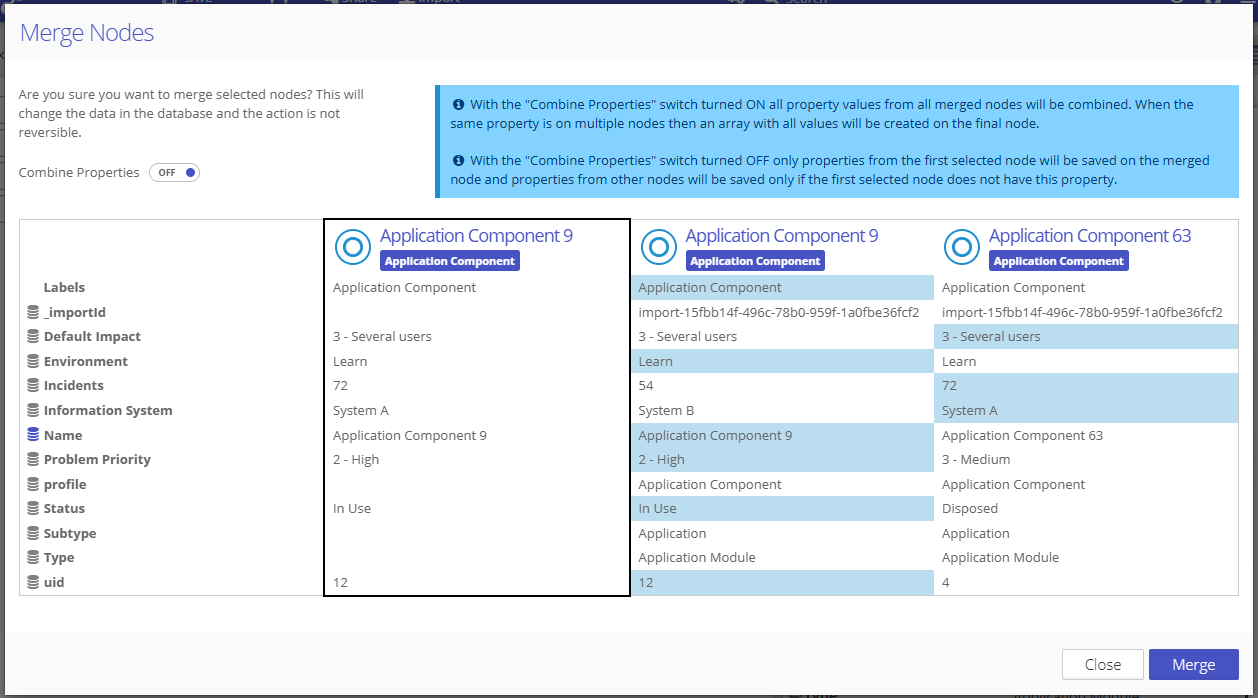
Graph modelling and editing are major parts of the graphlytic visualization experience. We are improving these features with every release, and this one is no exception. In this release, node merging was completely reworked based on user feedback. The goal was to enable full flexibility when merging nodes with features like:
The result is a modal window that handles all the mentioned features and is available in the control panel by default (no need to set up the widget like in the previous version).
View management (predefined style rule combinations) is now much easier. A user with the Project Settings management permission can manage views directly in the visualization. When the visualization's styling is set up, to save it as a new view, just click on the "Add View" option, give it a name, and that's it - all users in the project will be able to use the view in all visualizations across the project.

The fulltext search experience has been improved with new features and improvements that have been in our backlog for quite some time. The focus was on adding new filtering options, fuzzy and bulk search, and making it all seamlessly work together. We have also expanded the option to use Azure AI Search integration with all supported graph databases instead of just Azure Cosmos DB.
Range filters are essential when working with continuous data types like dates or numerical values, as they allow users to precisely narrow down results to a specific interval of interest. Whether you're analyzing trends over a particular time period or filtering entities based on thresholds or scores, range filters provide the control needed to extract meaningful insights without overwhelming noise. That's why we have improved the range filtering across the whole app. Range filters are available out-of-the-box for properties with data types "number" or "datetime" (data type has to be set in the Data Schema).
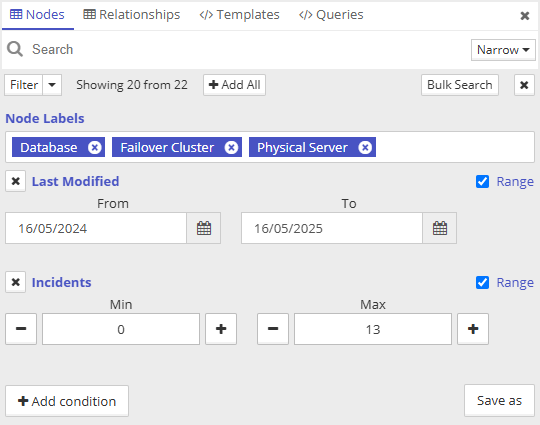
Bulk search is a powerful feature for quickly finding and working with multiple entities at once - especially when dealing with large datasets. By simply copying and pasting a list from a spreadsheet, users can search for many items in one go, saving time and effort. Search results can be viewed and filtered manually before adding to the visualization.
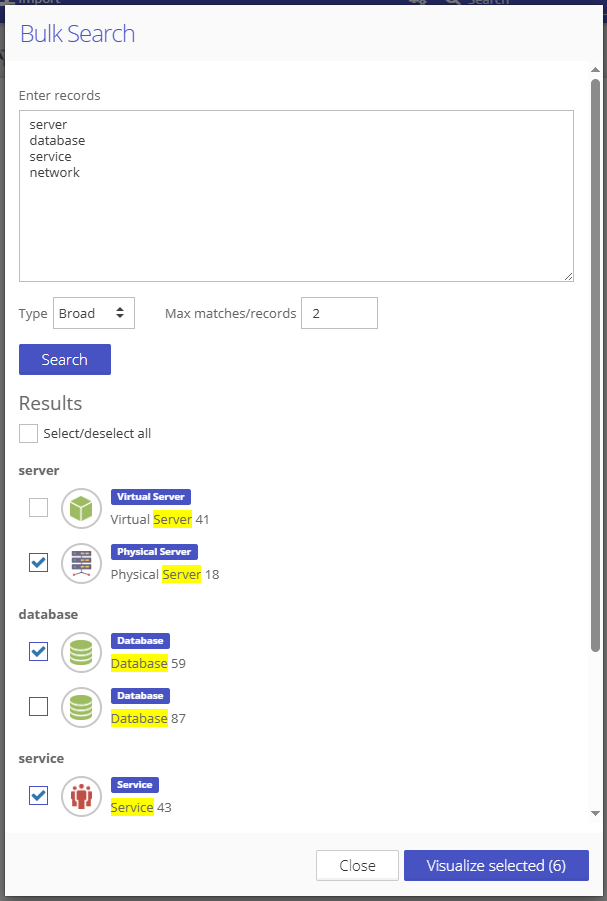
Broad and fuzzy search is crucial when working with data that includes names, addresses, or other text fields prone to inconsistencies and typos. These types of searches help uncover relevant results even when exact matches don’t exist, ensuring that valuable connections aren’t missed due to minor spelling errors or formatting differences. This flexibility greatly enhances data reliability and completeness, especially in real-world datasets where imperfections are the norm.
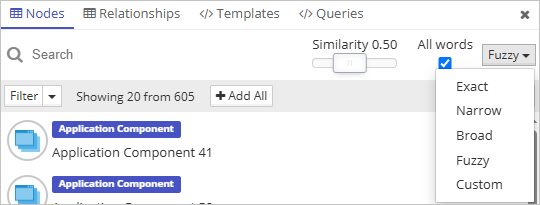
There are several search modes available:
Exact - all search words must be present in the element and written exactly as typed.
Narrow - all search words must be present in the element’s data (logical AND).
Broad - at least one of the words has to be present in the element’s data (logical OR).
Fuzzy - allows you to set different “fuzziness” levels for the similarity search. Fuzzy search also has the option to change between logical AND (All words have to be present) and logical OR (at least one word has to be present) with the check box “All words”.
Custom - the search term is passed to the search engine exactly as it is typed. This option is used by the more advanced users who know how to write complex fulltext search queries (e.g., Lucene queries or similar, based on the chosen search connector).
Memgraph now offers an integrated full-text index in beta, and to take advantage of this exciting new feature, we’ve developed a Memgraph search connector. Currently, this index supports node searches only, but we’re optimistic that support for relationship searching will be available soon.
The Jobs UI has been completely revamped, now featuring real-time status updates directly in the jobs list. Auto-refresh has been added to both the jobs list and job history, making it easier than ever to monitor the live progress of running jobs at a glance.
We’ve expanded our out-of-the-box support to include more popular database drivers, such as MySQL, Oracle DB, MS SQL Server, and PostgreSQL. Azure Cosmos DB import has been enhanced with the new Cosmos Bulk Import feature, which leverages the .NET endpoint for significantly faster and more efficient data ingestion. The new release includes an XPath driver, enabling seamless data extraction from XML sources.
In addition to the existing Python driver, which can be used to run LLM prompts, including integrations with libraries like LangChain, we’ve introduced a dedicated LLM driver. This new driver enables users to execute language model prompts directly through our Cloud AI services, delivering powerful, streamlined AI-driven data processing without the need for custom setup.
As a final note, Graphlytic is now also available in Spanish. Users can easily switch to this language option directly from their profile settings.
Michal
CEO and co-founder of Graphlytic
Demtec, s.r.o.
Karpatské námestie 10A
831 06 Bratislava
Slovakia
ID: 47807890
VAT ID: SK2024104434
EMAIL: info@graphlytic.com
TEL: +421 944 289 809