
Transaction monitoring systems generate large volumes of alerts, and only a small fraction turn out to be genuine. AML analysts and compliance officers still have to manually trace how funds move through layers of shell companies, nominee directors and offshore structures before a Suspicious Activity Report (SAR) or Suspicious Transaction Report (STR) can be filed. That work is slow by nature: ownership is often deliberately obscured across jurisdictions, bank secrecy regimes and corporate registries that don't talk to each other, and a single case can easily involve hundreds of linked entities.
Regulatory pressure makes the problem worse. Filing deadlines are fixed, fines for inadequate monitoring keep growing, and investigators are expected to document a clear, defensible chain of evidence - not just a conclusion. Spreadsheets and case notes don't scale once a case grows past a handful of entities, and patterns such as structuring, layering or smurfing are very hard to spot in rows of transactions, even though they stand out immediately once the same data is drawn as a graph.
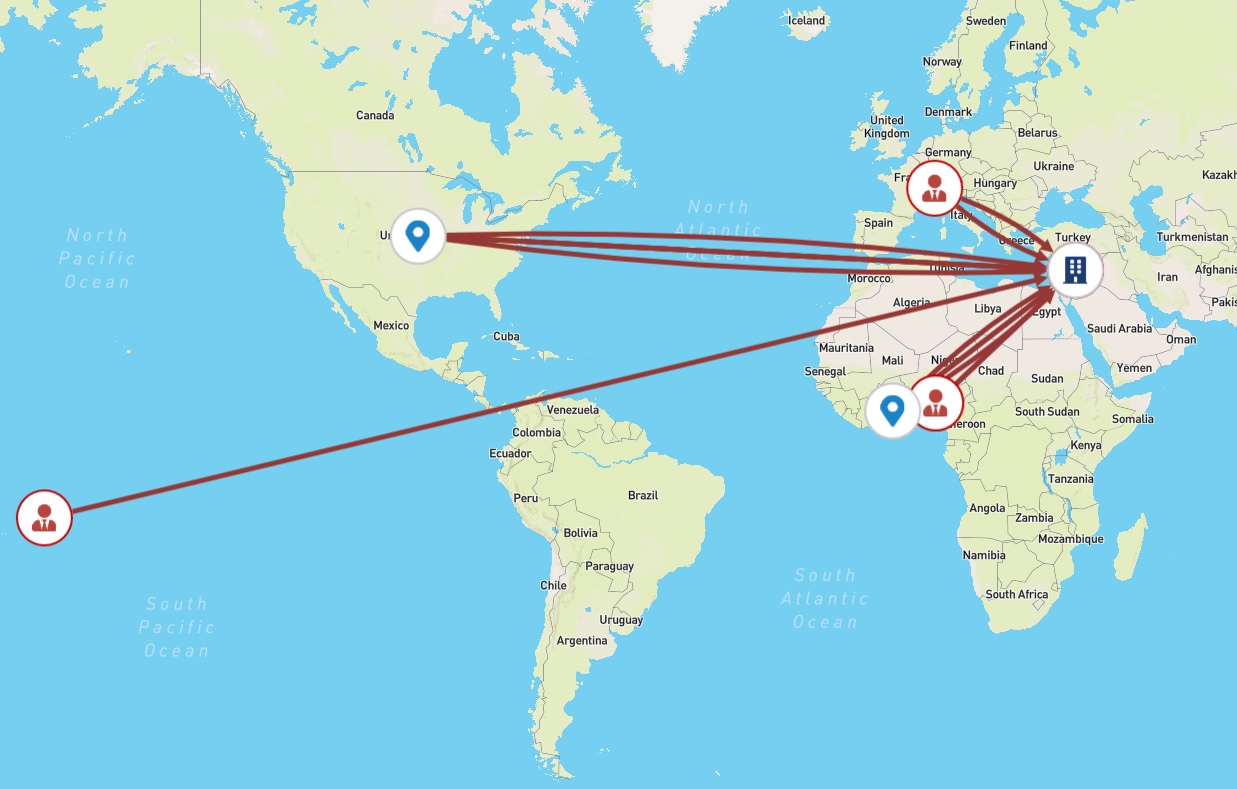
Graphlytic turns transaction and ownership data into a connected graph of accounts, companies, individuals and transfers. Analysts can follow the flow of funds across an unlimited number of hops, and the application surfaces entities that share an address, phone number, IBAN or director - links that are easy to miss in tabular data but immediately visible once drawn as a graph. Beneficial ownership chains that span several layers of holding companies become a short walk through the graph instead of a manual cross-referencing exercise across multiple registries.
Graphlytic can be deployed on-premises, which matters for financial institutions working with data that cannot leave their own infrastructure. For a practical illustration of the same approach applied to real-world leaked financial data, see our Panama Papers demo, built on the ICIJ Offshore Leaks dataset of over 200,000 offshore entities, their officers and intermediaries.

Demtec, s.r.o.
Karpatské námestie 10A
831 06 Bratislava
Slovakia
ID: 47807890
VAT ID: SK2024104434
EMAIL: info@graphlytic.com
TEL: +421 944 289 809


