Permission needed: Data management
Table of Contents
Users with this permission can create, update, or delete data from the database in Graphlytic. Additional limitations can be imposed on the user based on the Project Settings .
GUI form for creating elements can be customized using the "nodeAttributeGroups" attribute in the Data Schema.
1. Create node
Nodes can be created in the Visualization.
Open or create a visualization.
Use the "Create node" icon.
Fill in the mandatory or optional data.
Confirm by pressing the "Save" button.
Node is created in the graph database and added to the visualization.
2. Update node
Nodes can be updated in the Visualization.
Open or create a visualization.
Select a node in the visualization.
Open the Detail tab in the right panel.
Edit the node labels or properties. Every change is automatically saved in the graph database.
3. Delete node
Nodes can be deleted on the Queries page or in the Visualization.
Queries page
Main menu (top right) - Queries page
Use a "Node Filter" query type.
Enter search criteria to find the node.
Click the "Delete" icon next to the node in the search result. A confirmation window is shown.
Visualization
Open or create a visualization.
Select a node in the visualization.
Toolbox: Delete all selected elements using the "Delete selected from database" icon. The confirmation window appears.
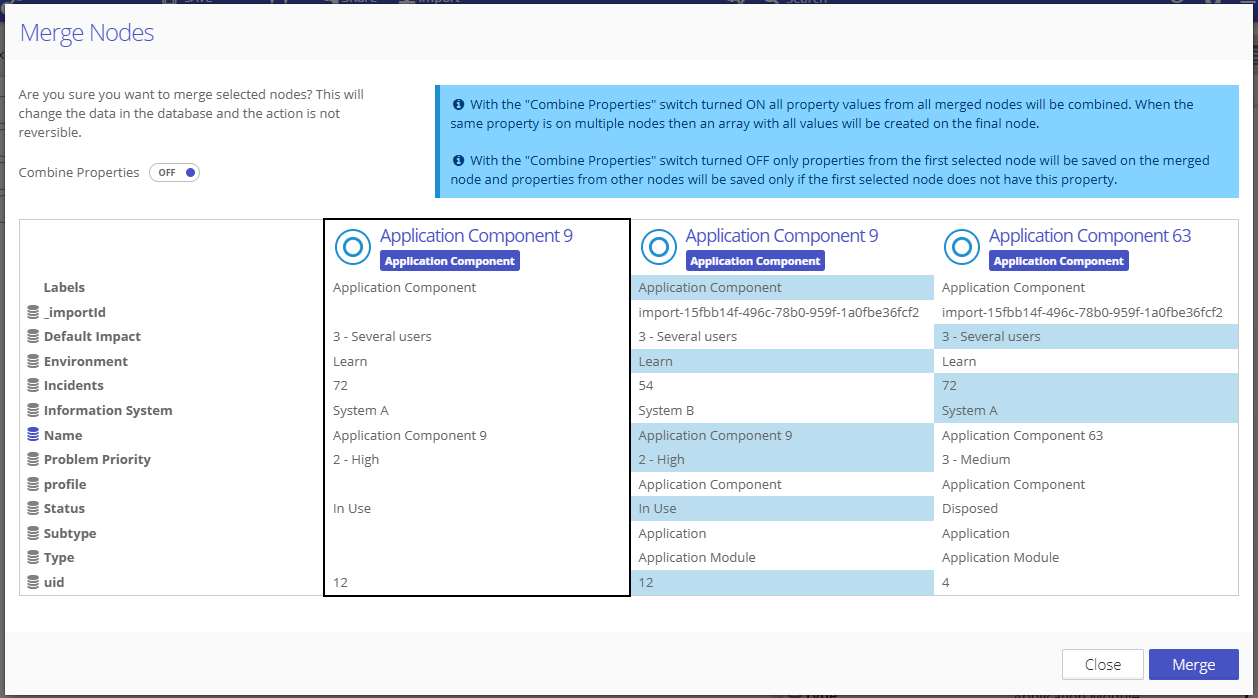
4. Merge nodes
Nodes can be merged in the Visualization.
Open or create a visualization.
Select multiple nodes (at least two) in the visualization.
Toolbox: Open the merge dialog using the “Merge Nodes” button.
Combine the properties for the result node manually or use the “Combine Properties” switch to use a deduplicated combination of all data from all selected nodes.
Save the changes into the graph database with the “Merge” button. Relationships from merged nodes will be recreated and connected to the final merged node.
5. Create relationship
Relationships can be created in the Visualization.
Visualization
Open or create a visualization.
Use the "Create new edge" icon to turn on the relationships drawing tool.
Click and start dragging from a start node in the visualization (start the dragging from the red dot displayed after hovering over the start node).
Drag the cursor to the end node, and once you reach the end node, release the mouse button. You can create multiple relationships with the same data by dragging the cursor over various nodes.
Enter data into the create form and confirm by pressing the "Save" button.
6. Update relationship
Relationships can be updated in the Visualization.
Open or create a visualization.
Select a relationship in the visualization.
Open the Detail tab in the right panel.
Edit the relationship type or properties. Every change is automatically saved in the graph database.
7. Delete relationship
Relationships can be deleted on the Queries page or in the Visualization.
Queries page
Main menu (top right) - Queries page
Use a "Relationship Filter" query type.
Enter search criteria to find the relationship.
Click the "Delete" icon next to the relationship in the search result. A confirmation window is shown.
Visualization
Open or create a visualization.
Select a relationship in the visualization.
Toolbox: Click the "Delete selected from database" icon to delete all selected elements. The confirmation window will appear.